Vacancy Reduction Hub
Cut Vacancy Days, Protect Cash Flow, and Grow NOI With a Proactive System
Vacancy is the most expensive silent expense in your rental business because it hits twice: you lose rent and you still pay the mortgage, taxes, utilities, and time. For independent landlords and small property managers overseeing 1 to 100 units, vacancy reduction comes down to four disciplines applied consistently: measuring performance in days rather than impressions, executing the leasing workflow without friction, building a proactive renewal system that prevents vacancies before they open, and maintaining year-round marketing visibility so you are never starting from zero at turnover. This hub connects to focused resources covering every dimension of the vacancy lifecycle, from listing quality and showing execution through predictive renewal insights and tenant review systems.
Vacancy Reduction Hub: Cut Vacancy Days, Protect Cash Flow, and Grow NOI With a Proactive System
Vacancy is the most expensive silent expense in your rental business because it hits twice: you lose rent and you still pay the mortgage, taxes, utilities, and time. For independent landlords and small property managers managing 1 to 100 units, vacancy reduction is not one tactic. It is a chain of small, controllable steps that either compress or expand your time-to-lease. The national rental vacancy rate has trended higher in recent quarters, and leasing timelines have stretched in many markets. In that environment, waiting to market until after notice, or relying on a post-and-wait approach, compounds your risk quickly.
Shuk's vacancy-reduction system is built to keep you ahead of the next gap with predictive lease renewal insights, continuous marketing visibility, and tenant review systems that help you retain strong residents and attract the next one faster. This hub curates practical resources, proof, and next steps so you can reduce vacancy days and strengthen NOI without adding chaos to your week.
What you will get here: fewer vacancy days through earlier renewals and better leasing execution when turnover happens, and higher NOI confidence through clearer numbers, faster decisions, and repeatable processes.
Start today: Track your notice-to-lease timeline for every unit and treat it as a KPI, not a surprise. Set a rule that renewal outreach begins before you think you need it.
The Four Disciplines Every Vacancy Reduction System Requires
Most landlords treat vacancy as a marketing problem. In practice it is four disciplines that interact and reinforce each other. Weak execution in any one of them compounds the cost of every turnover.
Measuring in days is where most vacancy strategies fall apart. Landlords who track vacancy as a rough annual rate cannot see the individual turn performance that actually drives results. Days vacant per turn and days from listing live to lease signed are the two metrics that reveal whether your process is compressing or expanding over time.
Leasing execution determines how quickly a qualified tenant moves from inquiry to signed lease. Strong listings, fast response times, friction-free showings, and immediate application steps after tours are the operational variables that separate landlords who fill units in two weeks from those who average six.
Renewal strategy is the highest-leverage vacancy tool because retention avoids the entire turn: marketing, showings, cleaning, repairs, and days empty. The landlords who perform best treat renewals like pre-leasing, starting earlier, standardizing the message, and using data signals rather than guesswork to prioritize outreach.
Year-round visibility means you always have a warm pipeline rather than starting from zero at turnover. Maintaining consistent marketing presence so prospective renters know your properties before a unit becomes available is the difference between a 10-day turn and a 45-day one.
Curated Resources: Vacancy Fundamentals and Advanced Optimization
Vacancy reduction resources below are grouped into two tracks. Vacancy Fundamentals covers pricing, listing quality, showing flow, and communication for building a clean, repeatable baseline. Advanced Optimization covers proactive renewals, year-round marketing visibility, and resident experience signals for shrinking vacancy further once the fundamentals are solid.
Vacancy Fundamentals
1. Vacancy Rate and Days Vacant Calculator
If you manage 1 to 100 units, vacancy is easiest to control when you measure it in days rather than feelings. A calculator translates one empty unit into a monthly and annual income impact, and lets you compare your performance against your own history rather than a national headline that may not reflect your market.
Track two metrics: days vacant per turn, and days from listing live to lease signed. Review them monthly and set a target to beat your last quarter by 10%. If you cannot say your last three turns averaged specific numbers, you do not have a vacancy strategy. You have a vacancy hope.
Scenario: You own a 6-unit building. One unit sits empty for 30 days. Even if your annual vacancy rate looks acceptable, that single month can wipe out a meaningful portion of your yearly cash flow. Measuring it in days makes the cost visible and the fix actionable.
2. Listing Quality Guide: Photos, Descriptions, and Trust Signals That Shorten Time-on-Market
When leasing timelines stretch, the landlords who win are not always the cheapest. They are the clearest. Strong listings reduce back-and-forth, attract better-fit renters, and improve conversion from inquiry to showing to application. In slower periods, renters compare more options, scrutinize details, and delay decisions. A clearer listing is often the fastest renovation you can do.
Add a friction-killer section to every listing: requirements, deposit structure, availability date, and showing method. Your goal is to answer the top 10 questions before a renter asks them.
Scenario: A first-time landlord posts five dim photos, no floor plan, and a vague description. They get inquiries but most ghost after asking basics. Another owner includes 20 bright photos, room dimensions, a simple pet policy, and a straightforward how-to-apply section. They get fewer junk inquiries but more showings that convert.
3. Showings and Follow-Up Playbook: The Standard That Prevents Dead Leads
Even great listings fail when the workflow is slow. Leads go cold fast, especially when renters are touring multiple units simultaneously. A showing playbook standardizes response time, scheduling, and follow-up so you do not lose qualified prospects to delay.
Set a non-negotiable: every inquiry gets a same-day response and a scheduled next step. If you cannot do same-day consistently, tighten your showing windows so renters can plan and you do not burn time. Vacancy is often not a marketing problem. It is a follow-through problem.
Scenario: A property manager with 18 units replies to inquiries once per day. By the time they respond, the renter has already toured two other options. After implementing a same-day response rule, they confirm a showing window quickly and send an application link immediately after the tour, converting more showings into completed applications.
Advanced Optimization
4. Predictive Renewal Readiness Guide: Prevent Vacancy Before Notice Arrives
The lowest vacancy day is the one that never happens. Renewal strategy is your highest-leverage vacancy tool because retention avoids the entire turn: marketing, showings, cleaning, repairs, and days empty. Your best defense is knowing which residents are likely to renew, which are at risk, and what to do earlier.
Create a renewal calendar that starts 90 to 120 days before lease end. Use predictive renewal insights to flag at-risk leases early so you can stabilize retention or start marketing before the turn begins with an accurate timeline. Vacancy reduction is not just about filling faster. It is about keeping longer, on purpose.
Scenario: You manage 22 units and wait for tenants to bring up renewal. Two of your best residents quietly plan to move and you learn 30 days out. You scramble and eat 25 vacancy days. With a proactive system, you would have started renewal conversations earlier, identified uncertainty signals, and offered clear options well before the decision was already made.
5. Year-Round Marketing Visibility Blueprint: Stay Discoverable Even When You Are Not Actively Leasing
Many DIY landlords market only when a unit is empty. That approach can be costly in a slower leasing environment where time-to-lease has stretched in many markets. Year-round visibility means you always have a warm pipeline: renters who have seen your properties, trust your process, and can move quickly when availability opens.
Maintain a coming-soon process: collect inquiries 30 to 60 days ahead when you can, and keep your property marketing consistent so you are not starting from zero at turnover. The goal is not to advertise more. The goal is to advertise earlier and more consistently so vacancy days compress.
Scenario: A 12-unit landlord in a suburban market posts listings only after a unit is vacant. Their average vacancy is 45 to 60 days. Another owner keeps a consistent presence with updated property pages, consistent branding, and a waitlist-style intake for future availability. When a tenant gives notice, they already have interested prospects to tour within days.
6. Tenant Review and Reputation System: Build the Trust Signals That Improve Conversions
Renters make decisions based on perceived risk. A unit that looks great but feels unknown can lose to a slightly worse unit with clear credibility signals. Review systems also support retention because residents are more likely to stay when they feel heard and see issues resolved consistently.
Choose two review moments: after a successful maintenance completion and after a renewal. Keep the request short, consistent, and automated where possible. Reviews are not vanity. They are a vacancy-reduction lever because trust shortens decision time.
Scenario: A small operator notices that applicants repeatedly ask the same questions: "Are repairs handled quickly?" and "Is the landlord responsive?" Without a reputation system, each leasing cycle starts from scratch and qualified renters hesitate. After implementing a structured review request at key moments, they build a simple trust layer that increases showing-to-application conversion.
What Vacancy Reduction Looks Like When the System Works
Macro conditions matter. Rental vacancy rates and leasing timelines have both trended in directions that make execution more important than it was in years of strong demand. When list-to-lease times stretch and vacancy rates rise, the gap between a landlord with a proactive system and one without becomes measurable in lost income.
The two examples below reflect how a proactive approach using predictive renewal insights, continuous marketing visibility, and better resident experience signals translates into outcomes.
Case Study 1: Independent landlord cuts vacancy from 60 to 15 days with year-round visibility
A DIY landlord owned 12 units across two small buildings. Each turnover historically produced 45 to 60 days of vacancy. The owner marketed only after move-out, relied on inconsistent follow-up, and often faced pricing uncertainty at the start of every leasing cycle.
Using Shuk, the owner implemented a continuous visibility approach: standardized listing templates, a coming-soon workflow, and faster lead follow-up. They tightened the showing process with pre-set windows and immediate application steps after tours.
Average vacancy days per turnover fell from approximately 60 days to approximately 15 days over two turns, converting a chronic vacancy pattern into a predictable, shorter leasing cycle.
Actionable takeaway: If you currently wait until the unit is empty, shift your timeline forward. Begin marketing the moment you have a credible availability date, even if it is coming soon.
Case Study 2: Property manager improves retention by 20% with predictive renewal insights
A small property management team oversaw 45 units across single-family and small multifamily properties. Their vacancy was not only a leasing issue. It was a renewal issue. They were often surprised by non-renewals, leaving too little time to market before a unit went dark.
They adopted Shuk's predictive renewal insights to identify renewal risk early, standardized a renewal communication cadence covering options, timelines, and clear expectations, and paired this with a resident experience loop of issue resolution and review prompts.
The team improved retention by 20% over the next renewal cycle and reduced surprise non-renewals, creating more predictable leasing timelines and fewer emergency turns.
Actionable takeaway: Treat renewals like pre-leasing. Start earlier, standardize your message, and use data signals rather than guesswork to prioritize outreach.
Frequently Asked Questions
How do I get started reducing vacancy if I only have 1 to 5 units?
Start by controlling the controllables: measure vacancy in days, tighten your response time, and standardize your listing and showing workflow. Your biggest gains come from removing friction in your process. Pick one metric and one workflow improvement this week. Track days from listing live to lease signed, and implement same-day inquiry response even if it starts as a templated reply. Small process improvements compound quickly at a small portfolio size because every vacant day represents a larger percentage of your annual income.
What is the fastest way to reduce vacancy time without dropping rent?
The fastest non-price lever is speed and clarity: faster lead response, clearer listings, and a smoother application-to-approval pipeline. Before you cut rent, run a quick conversion audit. Are you replying within hours rather than days? Does the listing answer the pet policy, deposit structure, and move-in timing clearly? Do you send the application immediately after the tour? In slower conditions, renters compare more options and delay decisions. Removing uncertainty from your listing and process often closes the gap without any price reduction.
When should I start marketing a unit before it is available?
Start as early as you can with an accurate availability date. In markets where leasing timelines have stretched, two-week turns are not guaranteed. If your region is experiencing higher vacancy rates, earlier marketing is a practical hedge. Create a pre-lease checklist at the moment notice is received: confirm the earliest realistic move-in date, schedule one to two showing blocks in advance, and publish a coming-soon listing immediately with clear expectations. The landlords who fill units fastest are the ones who never start from zero.
Can I collect rent while a unit is vacant?
If a tenant has legally vacated, rent typically stops. But if a tenant leaves early or breaks a lease, many jurisdictions require you to mitigate damages by re-renting, meaning your marketing and documentation both matter. Keep a vacancy file with a move-out and surrender confirmation, a listing-live date, and a showing log with applicant notes. Even if you manage casually, treating vacancy like an auditable process protects you and supports any claim for lost rent during the period the unit was reasonably marketed.
How do I measure the true cost of vacancy beyond lost rent?
Lost rent is only the headline. Track vacancy cost in three buckets: income loss calculated as days vacant multiplied by daily rent, turn cost covering make-ready, cleaning, and utilities, and risk cost covering delays, rushed tenant selection, and any eviction-related exposure. Most landlords who track all three find the true per-vacancy cost is significantly higher than a single month of rent. That full picture is what makes proactive renewal strategy and pre-leasing worth the effort.
Next Step: Build Your Proactive Vacancy Reduction System
Vacancy does not usually explode overnight. It creeps in when renewals are reactive, marketing starts late, and the leasing workflow depends on how busy you are that week. The landlords who reduce vacancy consistently share three disciplines: they measure performance in days and review it monthly, they run a standardized leasing workflow that does not depend on individual memory, and they treat renewals as a proactive system rather than an annual surprise.
Shuk is built to help you run vacancy reduction as a system: predictive lease renewal insights so you can keep good tenants longer and see risk earlier, continuous marketing visibility so you are never starting from zero when a unit turns, and tenant review tools to build the trust signals that improve conversions and reduce churn.
If you want to see how the workflow fits your portfolio, book a demo and walk through how Shuk's renewal, leasing, and visibility tools work together for landlords managing 1 to 100 units.
{
"@context": "https://schema.org",
"@type": "FAQPage",
"mainEntity": [
{
"@type": "Question",
"name": "How do I get started reducing vacancy if I only have 1 to 5 units?",
"acceptedAnswer": {
"@type": "Answer",
"text": "Start by controlling the controllables: measure vacancy in days, tighten your response time, and standardize your listing and showing workflow. Pick one metric and one workflow improvement this week. Track days from listing live to lease signed, and implement same-day inquiry response even if it starts as a templated reply. Small process improvements compound quickly at a small portfolio size because every vacant day represents a larger percentage of your annual income."
}
},
{
"@type": "Question",
"name": "What is the fastest way to reduce vacancy time without dropping rent?",
"acceptedAnswer": {
"@type": "Answer",
"text": "The fastest non-price lever is speed and clarity: faster lead response, clearer listings, and a smoother application-to-approval pipeline. Before you cut rent, run a conversion audit. Are you replying within hours rather than days? Does the listing answer the pet policy, deposit structure, and move-in timing clearly? Do you send the application immediately after the tour? Removing uncertainty from your listing and process often closes the gap without any price reduction."
}
},
{
"@type": "Question",
"name": "When should I start marketing a unit before it is available?",
"acceptedAnswer": {
"@type": "Answer",
"text": "Start as early as you can with an accurate availability date. Create a pre-lease checklist at the moment notice is received: confirm the earliest realistic move-in date, schedule one to two showing blocks in advance, and publish a coming-soon listing immediately with clear expectations. The landlords who fill units fastest are the ones who never start from zero."
}
},
{
"@type": "Question",
"name": "Can I collect rent while a unit is vacant?",
"acceptedAnswer": {
"@type": "Answer",
"text": "If a tenant has legally vacated, rent typically stops. But if a tenant leaves early or breaks a lease, many jurisdictions require you to mitigate damages by re-renting, meaning your marketing and documentation both matter. Keep a vacancy file with a move-out confirmation, a listing-live date, and a showing log with applicant notes. Treating vacancy like an auditable process protects you and supports any claim for lost rent during the period the unit was reasonably marketed."
}
},
{
"@type": "Question",
"name": "How do I measure the true cost of vacancy beyond lost rent?",
"acceptedAnswer": {
"@type": "Answer",
"text": "Track vacancy cost in three buckets: income loss calculated as days vacant multiplied by daily rent, turn cost covering make-ready, cleaning, and utilities, and risk cost covering delays, rushed tenant selection, and any eviction-related exposure. Most landlords who track all three find the true per-vacancy cost is significantly higher than a single month of rent. That full picture is what makes proactive renewal strategy and pre-leasing worth the effort."
}
}
]
}
Shuk helps landlords and property managers get ahead of vacancies, improve renewal visibility, and bring more predictability to every lease cycle.
Book a demo to get started with a free trial.
The following guides cover every dimension of reducing rental vacancy: vacancy rate calculation and performance benchmarking, listing quality and time-on-market compression, showing and follow-up workflow, predictive lease renewal strategy, year-round marketing visibility, and tenant review systems that build the trust signals that shorten leasing cycles. Together they give independent landlords a repeatable, proactive system for keeping strong residents longer and filling vacancies faster when turnover happens.
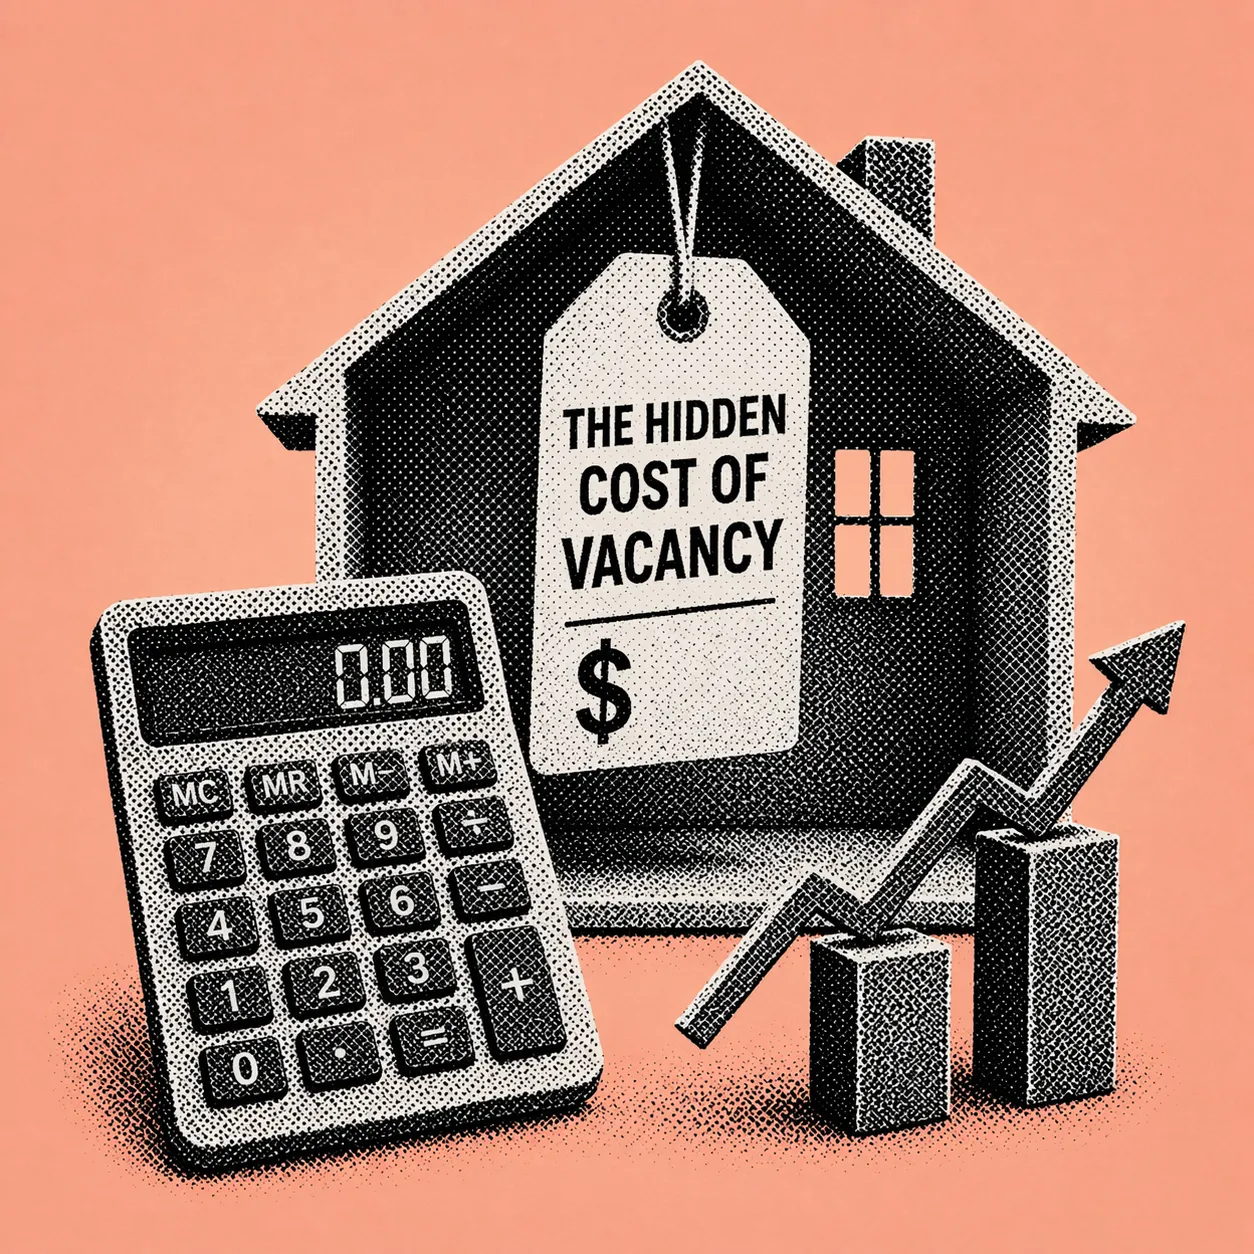
The Hidden Cost of Vacancy: A Data-Driven Calculator and Decision Framework for Landlords
A vacant unit feels straightforward. You are losing rent. But if you have watched a solid rental sit empty while your mortgage, taxes, and insurance keep auto-drafting, you already know the reality: vacancy is a stack of costs that show up in different places, not a single line item.
You are paying utilities you keep on for showings, lawn care you cannot skip, and insurance that does not pause. You are covering mortgage interest, property taxes, HOA dues, and reserves. And you are absorbing costs that do not show up until later: extra wear from repeated showings, delays to planned improvements, and the opportunity cost of cash that could have been deployed elsewhere.
The timing makes this especially relevant. National rental vacancy has hovered around the low-7% range in recent quarters, with the vacancy rate reaching approximately 7.2% in 2025 readings and noticeable regional differences throughout. Meanwhile, homes have averaged about 34 days on market in early 2026, and for a landlord every extra day compounds. The market has become increasingly renter-friendly as vacancy rises, which means pricing and speed-to-lease decisions carry more consequence than they did in a tighter market.
This guide gives you a repeatable vacancy cost calculator you can use every time a unit turns. You will build a complete vacancy analysis covering direct, indirect, and opportunity costs, compare 30, 60, and 90-day vacancy scenarios in one table, and use a simple decision framework to choose between rent reductions, incentives, or improvements.
Why Most Vacancy Math Is Incomplete
Most independent landlords do some form of vacancy math, but it is usually missing critical components. They count lost rent. They forget carrying costs that continue whether the unit is occupied or not. They underestimate indirect costs like leasing time, marketing, utilities, and the small expenses that do not look significant individually. And they rarely price decisions in break-even terms, so the choices become emotional: "I do not want to drop rent," "The unit is worth more," or "I will wait for the right tenant."
That last pattern is where vacancies become expensive. When you delay a decision by two weeks to hold firm on asking rent, you are not just preserving a higher number. You are gambling that the higher rent will outweigh the rent you did not collect, the bills you paid, and the downstream effects of a slower lease-up.
A data-driven approach is simpler than it sounds. You do not need complex models. You need a consistent method that covers five steps: calculating the cost of empty time using a complete cost list, classifying vacancy costs into direct, indirect, and opportunity categories, building a 30/60/90-day scenario comparison to see how quickly costs compound, deciding with numbers whether to cut rent, offer incentives, or invest in improvements, and running a break-even analysis that replaces guessing with a clear threshold.
Step 1. Build Your Direct Cost List
Direct costs are the most predictable component of a vacancy cost calculator because they are largely fixed. Start with the monthly expenses that continue whether the unit is occupied or not.
Direct cost categories to include: mortgage payment or at minimum the interest portion if you track principal separately, property taxes expressed as a monthly equivalent, landlord insurance as a monthly equivalent, HOA dues if applicable, utilities you keep on including electric, gas, water, sewer, and trash, core maintenance you cannot pause including lawn care, snow removal, and pest prevention, and a minimum reserves allocation even if you do not physically move money each month.
National averages provide a useful starting point. Average landlord insurance runs approximately $1,478 per year or about $123 per month, and it typically exceeds homeowners coverage. Median HOA fees have been reported around $135 per month with significant regional variation. The average monthly electricity bill is approximately $142. And property taxes average around $4,172 per year or about $348 per month, though your local bill can be dramatically different.
Example direct cost calculation: A two-bedroom unit would rent for $1,900 per month. While vacant, the landlord pays mortgage of $1,050, property taxes of $350, insurance of $125, HOA of $135, electric, gas, water, and trash totaling $210, and lawn and pest baseline of $60. Total direct monthly carrying costs: $1,930.
That means even before marketing or turnover work, the unit is costing approximately $64 per day in carrying costs. Lost rent adds another $63 per day. Together that is approximately $127 per day in vacancy impact before the costs most landlords forget to count.
Step 2. Add Indirect Costs
Indirect costs are real cash outflows or time costs caused by vacancy that do not show up as fixed monthly bills.
Typical indirect costs include listing fees and syndication costs, tenant screening and background check fees, showing time whether your own or paid, lockbox and signage, cleaning, paint touch-ups, carpet shampoo and minor repairs to pass your own standards, utility spikes from running heat or lights for showings, and faster deterioration risk when a unit sits empty because small problems like dry traps, pests, and humidity go unnoticed without an occupant.
Example: A landlord self-managing a duplex turns one unit and keeps rent firm for three extra weeks. During those three weeks they pay for a premium listing upgrade at $75, spend two Saturdays doing showings totaling eight hours, pay for a second cleaning after dusty foot traffic at $160, and run heat slightly higher for showings at $35 extra. That is $270 in direct cash plus the time cost. The larger point is that indirect costs tend to increase the longer a unit sits because you keep re-marketing, re-cleaning, and repeating showings.
A practical way to estimate indirect costs: use a flat amount per vacancy of $300 to $800 for initial turnover and leasing spend, plus a weekly amount after week two of $50 to $150 for re-listing boosts, additional cleaning, and utility creep.
Step 3. Quantify Opportunity Costs
Opportunity costs are the hardest to accept because they are not always a check you write. But they are central to a real vacancy cost calculator, especially for landlords who make pricing decisions based on what they feel the unit is worth.
Common opportunity costs include lost rent that cannot be recovered, delayed rent increases because you cannot raise rent on an empty unit, delayed improvements because cash goes to carrying costs instead of upgrades that could support higher future rent, and the alternative use of capital: money spent carrying a vacancy could have paid down higher-interest debt, funded a down payment on the next property, or earned interest elsewhere.
With rent growth slowing in many markets and vacancy trending upward in recent quarters per Census Housing Vacancies and Homeownership data, waiting for next month's higher rent is often less realistic than it felt in a tighter market. A simple opportunity cost calculation does not need to be precise. Start with lost rent, then add a cash drag factor: if your cash could earn 4 to 6% annually elsewhere, estimate opportunity drag as cash outflows during the vacancy period multiplied by the annual rate divided by 12, multiplied by the number of months vacant. This will not be exact, but it forces the right mindset: vacancy ties up cash and attention, and both have value.
Step 4. Run 30/60/90-Day Vacancy Scenarios
The most clarifying step in a landlord vacancy analysis is running the same assumptions across three time horizons so you can see how quickly costs compound.
Example assumptions: Market rent of $1,900 per month. Direct carrying costs of $1,930 per month. Indirect vacancy friction of $450 one-time for turnover, marketing, and small repairs, plus $50 per week after week two for relisting, additional cleaning, and utility creep. Opportunity drag excluded to keep the comparison conservative.
Daily figures: lost rent per day is $1,900 divided by 30, which equals $63.33. Carrying costs per day are $1,930 divided by 30, which equals $64.33. Combined baseline burn is approximately $127.66 per day.
30/60/90-Day Vacancy Cost Comparison
At 30 days: lost rent $1,900, carrying costs $1,930, indirect costs $550 (the $450 one-time plus $100 from two weeks of friction), total vacancy cost $4,380.
At 60 days: lost rent $3,800, carrying costs $3,860, indirect costs $750 (the $450 one-time plus $300 from six weeks of friction), total vacancy cost $8,410.
At 90 days: lost rent $5,700, carrying costs $5,790, indirect costs $950 (the $450 one-time plus $500 from ten weeks of friction), total vacancy cost $12,440.
A landlord who thinks they can wait out the market is waiting through a compounding cost structure. If a unit sits 90 days, the conservative all-in cost exceeds $12,000 before opportunity drag, the time value of labor, or postponed improvements are included. Seeing this table once typically changes behavior permanently.
Step 5. Decision Framework: Rent Reduction Versus Incentives Versus Improvements
Once you see the 30/60/90-day numbers, the question becomes tactical: what is the cheapest action that gets the unit occupied sooner without attracting the wrong applicant?
Start with a speed-to-lease reality check. With homes averaging about 34 days on market in early 2026, if your unit is still idle after two to three weeks of strong marketing, the market is giving you feedback. Price, presentation, or process is off.
Compare three levers. A permanent rent reduction lowers monthly income but reduces days vacant. A one-time incentive of $300 to $800 protects face rent while potentially closing the deal. An improvement investment spends capital now to increase rent and reduce vacancy duration on future turns.
Use a simple rule: spend less than your vacancy burn. From the example above, the baseline burn is approximately $127 per day. If a $400 incentive reliably shortens vacancy by even four days, the math works: four days at $127 equals $508 avoided against a $400 cost, a net benefit of $108 plus reduced hassle.
Comparing the three levers using the example:
Option one is cutting rent by $50 per month and leasing 10 days sooner. Savings are 10 times $127, which equals $1,270. Cost over 12 months is $600. Net benefit in year one is $670 if the cut genuinely speeds leasing.
Option two is offering a $500 move-in credit and leasing 10 days sooner. Savings are still $1,270. Cost is a one-time $500. Net benefit is $770, and the headline rent is preserved.
Option three is spending $1,200 on mid-grade improvements, leasing 20 days sooner, and raising rent by $40 per month. Vacancy savings are 20 times $127, which equals $2,540. Rent benefit over 12 months is $480. Total year-one benefit is $3,020 against a cost of $1,200 for a net benefit of $1,820, provided the improvement genuinely drives both speed and rent.
Address the emotional objection directly. Many landlords anchor to a number because it feels like what the unit is worth. But the market pays a clearing price today, not an appraised value. If vacancy is costing $127 per day, refusing a $50 per month adjustment is not holding the line. It is choosing a daily loss to avoid a monthly haircut. The math does not account for renovation investment or landlord sentiment.
Step 6. Break-Even Analysis: The Calculation That Ends Guessing
The break-even formula is the core tool most landlords need. It answers the question that every vacancy decision requires: how many days must this action save to pay for itself?
Break-even days saved = Cost of action divided by daily vacancy burn
Where cost of action is either the annualized rent cut, the one-time incentive, or the improvement cost, and daily vacancy burn is monthly rent divided by 30 plus monthly carrying costs divided by 30.
Using the example: rent of $1,900 divided by 30 equals $63.33 per day, carrying costs of $1,930 divided by 30 equals $64.33 per day, daily burn equals $127.66.
Three break-even examples:
A $500 incentive breaks even at $500 divided by $127.66, which equals 3.9 days. If the incentive helps lease even four days sooner, you are ahead.
A $50 per month rent reduction evaluated over a 12-month lease costs $600. Break-even is $600 divided by $127.66, which equals 4.7 days. If the rent cut reliably shortens vacancy by five or more days, it is financially justified in year one.
A $1,500 improvement breaks even at $1,500 divided by $127.66, which equals 11.8 days. If the upgrade reduces vacancy by approximately 12 days or also supports higher rent on the next turn, it is a strong move.
When you are stuck between waiting and adjusting, calculate break-even days first. Then ask one question: is it realistic that this action saves at least that many days in your market this month? If yes, act now rather than later.
Vacancy Cost Calculator Checklist
Use this as your repeatable workflow for every turnover.
Inputs per unit: Target monthly rent. Expected vacancy days: 30, 60, 90, or custom. Monthly carrying costs broken into mortgage, property taxes, landlord insurance, HOA, utilities kept on, and baseline maintenance and reserves.
One-time and time-based vacancy expenses: Turnover materials and labor, one-time. Marketing and listing, one-time. Screening and admin, one-time. Weekly vacancy friction after week two, expressed as a dollar amount per week.
Inline worksheet formulas: Daily burn equals rent divided by 30 plus carrying costs divided by 30. Lost rent equals rent multiplied by vacancy days divided by 30. Carrying cost during vacancy equals carrying costs multiplied by vacancy days divided by 30. Indirect costs equal one-time turnover plus one-time marketing plus weekly friction multiplied by the number of weeks beyond two. Total cost of empty rental equals lost rent plus carrying cost during vacancy plus indirect costs.
Decision test: Choose an action cost. Break-even days saved equals action cost divided by daily burn. If realistic days saved meets or exceeds break-even, take the action now.
Frequently Asked Questions
Should I lower rent immediately or wait a few weeks?
If your market baseline is roughly a month to generate qualified interest, waiting a short initial period can be reasonable if inquiries and showings indicate you are close to leasing. But if you are getting low response after strong marketing, your vacancy burn is accumulating daily. Run your vacancy cost calculator and compare the break-even days for a small rent reduction against continuing to wait. The math will tell you which position is cheaper.
Is a one-time incentive better than a permanent rent reduction?
Often yes, because incentives are finite while rent reductions repeat every month of the lease. Use break-even days saved: if a $500 credit saves four or more days in the example burn rate, it pays for itself. Incentives protect face rent, but only if they genuinely speed leasing and you screen tenants carefully so the incentive does not attract applicants who would not qualify under your normal criteria.
How do I estimate carrying costs if my taxes and insurance are paid annually?
Convert everything to monthly equivalents. For taxes, use your actual bill divided by 12. National averages are only useful if you are missing local data. For insurance, use your annual premium divided by 12. Your property may differ materially from national averages depending on location, age, and coverage level. The most reliable approach is to pull your actual bills from the prior 12 months and divide by 12 for each category.
What vacancy rate is acceptable for a small landlord?
There is no universal benchmark. National rental vacancy has been around the low-7% range in recent quarters with significant regional variation. For an individual landlord, what matters is average days vacant per turn and all-in vacancy cost per turn. Track both consistently. Then decide what acceptable means based on your cash reserves, debt obligations, and market seasonality rather than comparing against a national statistic that may not reflect your specific market.
If you want to make this math effortless and repeatable across every vacancy, book a demo to see how Shuk helps landlords categorize vacancy-related spending, run property-level financial reports during vacancy windows, and compare actual outcomes across turns so your decisions are based on your data rather than national averages.

How to Spot and Stop Tenant Move-Outs Before They Happen
A surprise move-out starts with a text you did not see coming, keys left on the counter, and a unit that starts draining cash the next morning. Tenant turnover routinely costs $1,000 to $5,000 per unit, and most landlords land closer to $2,500 to $4,000 once lost rent, cleaning, repairs, marketing, and screening time are included. Industry reporting puts the figure near $4,000 per resident before factoring in your own labor or the time spent showing units on nights and weekends.
The frustrating part is that most surprise move-outs were not actually surprises. The signals were there: late-payment drift, fewer maintenance requests, a sudden question about the lease end date, a complaint that went quiet after you thought you handled it. This guide gives you a practical system to spot those signals early, intervene with confidence, and keep occupancy steady.
Frequently Asked Questions
Find answers to common questions about our products and services
How do I get started reducing vacancy if I only have 1 to 5 units?
When should I start marketing a unit before it is available?
How do I measure the true cost of vacancy beyond lost rent?
What is the fastest way to reduce vacancy time without dropping rent?
Can I collect rent while a unit is vacant?
Vacancy does not usually explode overnight. It creeps in when renewals are reactive, marketing starts late, and the leasing workflow depends on how busy you are that week. Platforms like Shuk Rentals support vacancy reduction by bringing predictive renewal insights, continuous marketing visibility, and tenant review systems into one connected workflow so the gap between your leasing model and your actual NOI stays as narrow as possible.

