Property Acquisition Hub
How to Evaluate, Finance, and Scale Rental Property Acquisitions
Property acquisition is the process of evaluating, financing, and closing on rental properties in a way that protects cash flow and supports long-term portfolio growth. For landlords buying 1 to 100 units, disciplined acquisition comes down to four decisions made in sequence: how to evaluate the deal, how to finance it, how to select the right market, and how to scale without adding unsustainable operational complexity.
This hub connects to focused resources covering each dimension of the acquisition process. It also covers what to do in the first 90 days after closing to protect the NOI your underwriting modeled.
Property Acquisition Hub: A Complete Guide to Buying and Scaling Rental Properties
Property acquisition is the process of evaluating, financing, and closing on rental properties in a way that protects cash flow and supports long-term portfolio growth. For independent landlords and small property managers buying 1 to 100 units, disciplined acquisition comes down to four decisions made in sequence: how to evaluate the deal, how to finance it, how to select the right market, and how to scale without adding unsustainable operational complexity. Getting any one of these wrong can undermine returns even when the property itself is solid.
This hub connects to focused resources covering each dimension of the acquisition process. Work through them in order or jump to the topic most relevant to where you are today.
Four Decisions Every Rental Property Acquisition Requires
Most investors think about acquisition as a single event. In practice it is four decisions that compound on each other. A strong property in the wrong market underperforms. A well-located property with weak financing assumptions creates cash flow risk from day one. A portfolio that scales without operational systems becomes a second job rather than an investment.
Deal evaluation is where most acquisition mistakes originate. Sellers present best-case income and below-market expenses. Buyers who do not normalize expenses, verify rent rolls against actual deposits, and stress-test financing assumptions end up buying a spreadsheet rather than a property.
Financing structure determines whether a deal that looks good on paper actually works at the terms you can get. Investment property financing is priced differently than primary residence financing, and the right structure depends on your income documentation, property type, and scaling plan.
Market selection is where many beginner investors take the most unexamined risk. A strong property in a submarket with rising vacancy, weakening rent growth, or oversupply pressure will underperform regardless of how well it is managed. Market analysis is not optional research. It is part of underwriting.
Operational readiness is the dimension most acquisition guides skip entirely. Closing is not the end of the process. The first 90 days after closing determine whether your deal performs as modeled or drifts toward vacancy, deferred maintenance, and inconsistent rent collection. Investors who treat operations as an afterthought to acquisition consistently underperform those who treat them as part of the same system.
Curated Resources: Property Acquisition Guides
1. Investment Evaluation: Underwriting That Protects Your NOI
Protecting net operating income starts with a repeatable due diligence process that covers more than a home inspection. The due diligence checklist walks through each verification step. Reliable underwriting means verifying leases and deposits against actual bank statements, normalizing trailing income and expense history rather than accepting seller figures, and stress-testing reserves for capital expenditure items that commonly spike in the first 12 months.
Key underwriting disciplines that separate disciplined buyers from reactive ones include using in-place rents rather than projected rents, applying conservative vacancy assumptions based on local submarket data rather than national averages, and modeling financing at rates above your current quote to confirm the deal holds under reasonable stress conditions.
The investment property evaluation framework covers how to calculate cap rate, cash-on-cash return, and debt service coverage ratio in sequence, along with the reality checks that matter more than headline numbers: local vacancy behavior, maintenance intensity, tax and insurance volatility, and the durability of rent growth assumptions in your specific market.
2. Market Analysis: Pick the Right Submarket Before You Pick the Property
Market selection is a process, not a gut call. A credible market analysis requires triangulating three signals: rental demand relative to available supply, rent growth trends over the trailing 12 to 24 months, and forward-looking supply pressure from permitted and under-construction units in the submarket.
National rent growth averages are useful context but misleading as underwriting inputs. Individual submarkets within the same metro can diverge significantly. A submarket with strong employment access and constrained supply can outperform a city-level average by a meaningful margin, while a submarket with new supply coming online may see rents flatten or fall even as the broader market looks stable.
The rental property market analysis playbook also covers what to monitor in the 90 days after closing: rent comp movement, renewal offer timing, turn cost benchmarks, and vacancy exposure signals. Acquisition does not end at closing. The best investors treat post-close performance tracking as part of the same discipline as pre-purchase underwriting.
3. Financing Options: Match the Loan to Your Strategy
Rental property financing is priced differently than primary residence financing. Investment property mortgage rates typically carry a premium over primary residence rates, and typical down payment requirements for competitive terms commonly fall in the 20% to 25% range for conventional financing. The right structure depends on your income documentation, property type, and how many doors you plan to acquire over the next 12 to 24 months.
The financing comparison guide walks through each loan type in detail. Conventional financing tends to be the lowest-cost option for investors with straightforward W-2 income and strong reserves. Debt service coverage ratio loans prioritize property cash flow over personal income documentation, which makes them faster for self-employed investors or those with complex tax returns, though they commonly carry higher rates than conventional products. Small-balance multifamily programs are designed for stabilized 5-to-50 unit properties and operate under their own underwriting standards.
A second resource in this category covers the offer-to-close timeline in detail: inspection credits, rate lock considerations, insurance quote timing, property tax reassessment risk, and cash-to-close accuracy. Getting cash-to-close wrong and back-solving with optimism is one of the most common and expensive acquisition mistakes small investors make.
4. Portfolio Scaling: Add Doors Without Adding Chaos
Scaling a rental portfolio is not simply buying more properties. The portfolio scaling guide covers the full process from 1 unit to 100+. It is standardizing how you underwrite, onboard, lease, collect rent, and report performance so that each new unit increases cash flow without increasing your personal workload at the same rate. Investors who scale without operational systems consistently find that the portfolio becomes a second job rather than a passive income stream.
The operational ceiling for most self-managing landlords is not determined by unit count. It is determined by process quality. A landlord with solid systems for screening, lease execution, rent collection, maintenance tracking, and financial reporting can manage significantly more units than one managing without them, often with less stress and better financial outcomes.
The most common scaling failure pattern is \"property-by-property memory management\": keeping screening criteria, lease terms, and maintenance history in your head rather than in a documented system. This works at two or three units. It breaks down at five or ten, often in ways that create legal exposure, tenant dissatisfaction, and revenue leakage simultaneously.
What Disciplined Acquisitions Require in the Current Environment
Rental market conditions in recent years have shifted in ways that reward operational discipline over speculative assumptions.
Rent growth has moderated significantly from peak levels in many markets. Investors who acquired in 2021 and 2022 benefited from rapid rent appreciation that papered over weak underwriting. That environment no longer exists in most markets. Deals now need to work on in-place rents and realistic expense assumptions, not projected top-of-market performance.
Financing costs have increased, which compresses cash-on-cash returns at any given purchase price. This makes expense control and vacancy minimization more important than they were when rates were lower, because the margin for operational error is narrower.
Supply has increased in many Sun Belt and high-growth metros, which creates downward pressure on vacancy rates and rent growth in specific submarkets even as the broader market looks healthy. Submarket-level analysis matters more than it did when rising demand absorbed new supply across the board.
The investors performing well in this environment share three characteristics: they underwrite conservatively using in-place performance rather than projections, they document everything cleanly to stay financing-ready for the next opportunity, and they stabilize operations quickly after closing to protect NOI from the day they take ownership.
All Articles in This Hub
- Investment Property Evaluation — A financial analysis framework covering cap rate, cash-on-cash return, and DSCR.
- Due Diligence Checklist — Step-by-step verification process for buying rental property with fewer surprises.
- Rental Property Market Analysis — How to perform professional-grade submarket analysis before making an offer.
- How to Finance a Rental Property — Practical comparison of conventional, DSCR, and portfolio loan types.
- How to Scale a Rental Portfolio — From 1 unit to 10, 25, or 100+ without losing control.
- First Rental Property Mistakes — How to evaluate deals, finance smart, and manage without surprises.
- The 2% Rule in Rental Property — What it means, when it applies, and how to use it as a screening filter.
- The 3-3-3 Rule in Real Estate — A practical framework for evaluating rental property profitability.
{
"@context": "https://schema.org",
"@type": "FAQPage",
"mainEntity": [
{
"@type": "Question",
"name": "What are the steps to buying a rental property for the first time?",
"acceptedAnswer": {
"@type": "Answer",
"text": "Start by defining your buy box: property type, target cash flow range, and a realistic financing scenario. Then work through five steps in sequence: run an initial screen using rent comps and rough expense estimates, scope financing options early, complete full underwriting using normalized income and expenses, execute due diligence on leases and property condition, and build a 90-day stabilization plan before closing. The deal should work on in-place rents without requiring aggressive rent increases to meet your return targets."
}
},
{
"@type": "Question",
"name": "How do I evaluate a rental property quickly without missing red flags?",
"acceptedAnswer": {
"@type": "Answer",
"text": "Use a two-pass approach. The first pass is a speed check: verify that rent comps support the projected income, and confirm that taxes, insurance, and maintenance are not being ignored or understated. The second pass is precision: calculate net operating income using normalized expenses, test financing scenarios at your quoted rate and at a stressed rate, and validate that vacancy and rent growth assumptions are grounded in local submarket data rather than optimism."
}
},
{
"@type": "Question",
"name": "What financing option is best for rental property beginners?",
"acceptedAnswer": {
"@type": "Answer",
"text": "The best option depends on your income documentation and property type. Conventional financing is usually the lowest-cost path if you qualify, but investment properties carry a rate premium over primary residences and typically require 20% to 25% down for competitive terms. If your income documentation is complex, a debt service coverage ratio loan may close faster because it focuses on property cash flow rather than personal income. For 5-plus unit properties, small-balance multifamily programs operate under separate underwriting standards worth understanding before you make an offer."
}
},
{
"@type": "Question",
"name": "How do I pick a rental market when rent growth is slowing?",
"acceptedAnswer": {
"@type": "Answer",
"text": "Treat slower rent growth as a prompt to underwrite more conservatively, not as a reason to avoid investing. Identify two or three candidate metros, then analyze specific submarkets within those metros for employment access, supply pipeline, and vacancy trends. Build a buy box that requires the deal to cash flow at flat-to-modest rent growth. Markets with strong employment fundamentals and constrained new supply can still perform well even when national rent growth averages are soft."
}
},
{
"@type": "Question",
"name": "What operational systems do I need before scaling beyond my first rental property?",
"acceptedAnswer": {
"@type": "Answer",
"text": "Before adding a second or third property, document three things: your written screening criteria applied consistently to every applicant, your rent collection process including autopay, reminders, and a late notice timeline, and your maintenance intake process with a vendor list and response-time expectations. These three systems prevent the most common scaling failures: inconsistent tenant selection, cash flow disruption from payment gaps, and maintenance emergencies that consume time and money disproportionate to the problem."
}
}
]
}
Shuk helps landlords and property managers get ahead of vacancies, improve renewal visibility, and bring more predictability to every lease cycle.
Book a demo to get started with a free trial.
The following guides cover every dimension of buying and scaling rental properties: deal evaluation and underwriting, market and submarket analysis, financing structures and tradeoffs, and the operational systems that determine whether a portfolio grows profitably or becomes a second job. Together they give independent landlords a repeatable process for acquiring properties with disciplined assumptions and stabilizing operations quickly after close.

Understanding the 3-3-3 Rule in Real Estate
Most independent landlords do not lose money because they cannot analyze deals. They lose money because they analyze the wrong metrics at the wrong time.
A property that looks solid on closing day can turn into a cash drain after the first tenant cycle. Another deal that feels tight in month one might become a portfolio cornerstone once operations stabilize and rents reset. A third property might deliver mediocre early cash flow but build meaningful wealth over 30 years through amortization, inflation-adjusted rent growth, and a smart refinance strategy.
Here is the problem the 3-3-3 Rule solves: it forces you to underwrite an acquisition across three distinct time horizons, three months, three years, and three decades, so you do not confuse "survives onboarding" with "performs as a business" or "builds long-term wealth." The framework is a phased evaluation method designed to reduce time-horizon mistakes in acquisition decisions.
Common examples of this mistake: A great cash-on-cash return that ignored vacancies and capital expenditures, then collapsed after the first HVAC replacement. A rent projection that assumed perfect renewal behavior, but churn forced constant leasing and concessions. A long-term plan that assumed refinancing later without tracking debt service coverage ratio, which most lenders and investors prefer at approximately 1.25 or above for adequate cushion.
Treat the 3-3-3 Rule as a sequence, not a slogan. Pass the three-month stress test first, then earn the right to plan the three-year reposition, then decide whether the 30-year hold fits your life and portfolio.
What Each "3" Is Actually Asking
The 3-3-3 Rule is a decision framework for buy-and-hold investing that evaluates a property through three lenses.
The first three months ask whether the property can stabilize operationally and validate assumptions. This is the horizon of operational truth: are repairs, leasing, rent collection, and tenant onboarding working the way you underwrote?
The first three years ask whether the property can prove durable economics through at least one to three tenant cycles. Do you have a repeatable leasing engine, a predictable expense profile, and a realistic rent strategy? This is a classic hold versus refinance versus sell decision point.
The next three decades ask whether the property builds wealth through amortization, appreciation, and inflation-linked rent growth, and whether it matches your long-term exit and lifestyle goals. Historical U.S. rent growth averages approximately 2.5% annually, with NAR forecasting approximately 3.1% growth for 2026, but local underwriting always takes precedence over national averages.
The reason these distinctions matter in practice: a duplex may pass the three-month test but fail the three-year test if expenses drift and rents never get reset. An eight-unit may fail early if occupancy is unstable even when the long-term neighborhood story is strong. A high-cost market deal may be thin on cash flow but still represent a valid 30-year plan if you have reserves and financing flexibility.
Use different metrics at different horizons. Gross rent multiplier and a quick DSCR check for the first pass, a full operating expense ratio and rent and renewal plan for the three-year view, then IRR and refinance and exit scenarios for the 30-year view. Note that GRM ignores expenses and vacancy, making it a screening tool rather than a decision tool. IRR can mislead if reinvestment assumptions or timing are unrealistic.
How to Apply the 3-3-3 Rule: Six Steps
Step 1. Run the Three-Month Stabilization Stress Test
The first 90 days are about proving your assumptions around rent collection, repair cadence, and tenant fit. The goal is not perfection. It is avoiding a deal that requires constant emergency cash infusions.
Metrics to track in the first three months: Actual versus pro forma rent collected including timing and delinquencies. Initial maintenance and make-ready costs. Vacancy and lease-up time. A basic DSCR check using real expenses rather than projected figures.
Concrete examples: If your duplex underwriting assumed $300 per month in maintenance but month one required a $1,800 plumbing repair, your three-month truth is that reserves matter more than the spreadsheet. If you priced rent at the top of the market and attracted many inquiries but low-quality applicants, your screening and pricing strategy needs adjustment rather than patience. If one unit sits vacant longer than expected, your leasing system covering photos, follow-up speed, and listing distribution is the real bottleneck rather than the market.
Shuk's continuous marketing approach supports faster stabilization by keeping demand active rather than posting once and waiting. Use Shuk's workflow and performance tracking to watch early leasing and rent collection patterns in one place so month-one surprises become measurable inputs rather than vague stress.
Define a three-month pass-fail threshold before closing: if stabilization requires more than a specified amount in unexpected repairs or occupancy cannot reach a target level by month three, pause new acquisitions and rebuild reserves.
Step 2. Build a 12-Month Operating Model
The bridge between three months and three years is a realistic first-year model. This is where independent landlords most commonly underwrite too optimistically, especially around vacancy, capital expenditures, and expense creep.
Metrics to track in the first year: Net operating income calculated as income minus operating expenses. Operating expense ratio, often benchmarked in the 35% to 50% range depending on property type and market, with a high ratio signaling maintenance intensity or operational inefficiency. Cash-on-cash return calculated as annual pre-tax cash flow divided by cash invested, used carefully because it can ignore long-term drivers and mislead when capital expenditures and vacancies are under-modeled.
Concrete examples: A property with a great cash-on-cash return can still be fragile if it is one significant repair away from negative cash flow. A low operating expense ratio in month two can be a mirage if you have not yet experienced a turnover or a major service call. A DSCR that looks adequate on projected rents can drop quickly if insurance or taxes reset higher than expected.
Do not rely on a single metric. Combine operating expense ratio with DSCR and a conservative vacancy and capital expenditure line so you can distinguish "temporarily tight" from "structurally risky."
Step 3. Underwrite the Three-Year Proof
The three-year horizon is where rentals either become predictable businesses or remain owner-dependent side projects. This window is about verifying economic performance and serves as a decision point to hold, refinance, or sell.
Metrics to track through year three: Occupancy trend, where stability matters more than perfection since ultra-high occupancy can hide deferred turns and maintenance. Rent growth relative to local context and the historical U.S. average. Turnover and renewal performance, since leasing costs and downtime are portfolio profitability killers. Expense drift across taxes, insurance, utilities, and repairs.
Concrete examples: If your duplex renewals are strong, you can plan measured rent increases and reduce make-ready costs, improving the three-year outcome without major renovations. If your eight-unit has frequent move-outs, the cap rate on paper is irrelevant because the business is leaking money through vacancy and turns. If expenses rise faster than rents, you need operational changes around utility billing, preventive maintenance, or vendor renegotiation before adding doors.
Shuk's predictive renewal insights map directly to the three-year proof window. Knowing which tenants are likely to renew and why helps you plan pricing, maintenance timing, and marketing lead time so you are not reacting at day 28 of a 30-day notice.
Make year three your formal portfolio checkpoint. Decide in advance what performance triggers a refinance attempt, a rent-reset renovation, or a sale.
Step 4. Design the Three-Decade Wealth Plan
Thirty years is where rentals become a wealth strategy rather than just an income stream. The 30-year view centers on wealth accumulation through amortization, appreciation, and inflation-adjusted rent growth.
Metrics to track over ten to thirty years: Amortization and equity buildup, noting that early payments are interest-heavy and principal paydown accelerates later. Long-term return measures like IRR, useful for comparing scenarios across time but potentially misleading if reinvestment assumptions are unrealistic. Refinance feasibility through DSCR and cash-flow stability. Exit strategies including selling, executing a 1031 exchange if applicable, or holding for debt-free cash flow, all of which depend on your specific situation and tax circumstances.
Concrete examples: A property that breaks even early can become strong as rents rise while a fixed-rate payment stays constant, creating an inflation tailwind that compounds over time. A refinance may reduce risk through a longer term or fixed rate, or increase it through a rate reset, depending entirely on DSCR and the rate environment at the time. A 30-year plan without capital expenditure lifecycle budgeting is incomplete. Roofs, HVAC systems, and building exteriors do not respect your pro forma.
Use Shuk's historical performance views and analytics to produce lender-ready operating statements and trend lines when you revisit financing or consider portfolio expansion. Treat financing as a timeline rather than a one-time choice. Underwrite at least two paths: hold with current debt, and refinance in years three to seven if DSCR and NOI hit targets.
Step 5. Run Two Scenarios End to End
Scenario A: $250,000 duplex
Purchase price $250,000. Rents at $1,300 per unit equal $2,600 per month gross. Assuming 5% vacancy, effective gross is approximately $2,470 per month. If the operating expense ratio trends toward 45%, NOI is approximately $1,359 per month. If debt service is $1,200 per month, DSCR is approximately 1.13, which is thin.
Three-month decision: If the first turnover costs $4,000 and one tenant pays late twice, the deal may still be viable but only if reserves and leasing systems are strong. Use continuous marketing so you are never starting from zero on demand. Three-year decision: If predictive renewal indicators suggest one tenant is unlikely to renew, you can pre-market early, schedule upgrades between leases, and protect occupancy. Thirty-year decision: If rents grow near long-run historical averages and debt amortizes over time, this can shift from thin to strong, but only if year-one expense discipline is genuine.
Scenario B: $900,000 eight-unit building
Purchase price $900,000. Rents at $1,250 per unit equal $10,000 per month gross. Assuming 6% vacancy, effective gross is approximately $9,400 per month. At a 50% operating expense ratio, NOI is approximately $4,700 per month. With debt service of $4,000 per month, DSCR is approximately 1.18.
Three-month decision: The key risk is stabilization. One vacant unit and one delinquency can swing results significantly. Track leasing velocity and tighten collections immediately. Three-year decision: This is where operational scale pays off. Renewal forecasting and continuous marketing reduce vacancy loss across multiple units simultaneously. Thirty-year decision: If you plan to refinance after NOI improves, you need clean operating history and a DSCR cushion. Do not underwrite a refinance that only works under perfect rent growth assumptions.
In both scenarios, the rule is not the math. It is the discipline to re-evaluate the deal at three months and three years using real performance rather than hopeful projections.
Step 6. Avoid Common Pitfalls and Build Your Risk Playbook
The 3-3-3 Rule can overwhelm newer investors if treated as a giant spreadsheet rather than phased checkpoints. The tracking intensity can feel heavy without good tooling, which is a legitimate critique of any multi-horizon framework.
Common pitfalls and fixes: Over-relying on cash-on-cash. Pair it with operating expense ratio, DSCR, and a capital expenditure reserve line. Using GRM to decide rather than to screen. GRM ignores expenses and vacancy, so use it as a first filter and then underwrite NOI. Assuming rent growth will bail out bad operations. Let renewals, occupancy stability, and expense control be your three-year proof points rather than growth projections.
Software reduces blind spots rather than just adding data. Shuk's predictive renewal insights and continuous marketing reduce two of the largest small-landlord risks: surprise vacancy and reactive leasing. Its analytics dashboards help keep each "3" measurable without building a custom reporting stack.
Write a one-page playbook for each horizon: if a specific event happens in three months, execute this response. If a key performance indicator is missed by year three, refinance, sell, or reposition.
3-3-3 Rule Checklist and Template
Three-month stabilization checklist: Confirm actual rent collected versus underwritten rent including timing and delinquencies. Track vacancy days and leasing lead volume. Log all repairs and categorize by safety, habitability, preventive, and upgrade. Run a quick DSCR check using real expenses. Set a minimum cash reserve threshold for surprises.
12-month operating template for year one: Monthly income covering base rent and fees. Vacancy and credit loss line item. Operating expenses with categories covering taxes, insurance, utilities, maintenance, and administration. Operating expense ratio target in the 35% to 50% range. Annual cash-on-cash calculated carefully with capital expenditures and turnovers included.
Three-year proof checklist: Occupancy trend and turnover count. Renewal rate trend with reasons for move-outs categorized by pricing, maintenance, and life events. Rent increase policy tied to market conditions and tenant retention goals. Expense drift across taxes, insurance, and repairs with explanations for increases. Decision gate covering hold versus reposition versus refinance versus sell.
Thirty-year design checklist: Financing plan covering fixed versus adjustable rate risk. Amortization awareness noting that principal paydown accelerates in later years. Long-term return view using IRR as one tool with sanity-checked assumptions. Exit options and timeline aligned with life and portfolio goals.
If you cannot fill a line item confidently, that is not a reason to guess. It is a reason to investigate further or renegotiate terms before closing.
Frequently Asked Questions
How is the 3-3-3 Rule different from the 1% rule or other quick screens?
Quick rules focus on immediate rent-to-price relationships. The 3-3-3 Rule is broader: it tests whether a deal can stabilize in three months, prove sustainable economics over three years, and build long-term wealth over three decades. It is designed to reduce time-horizon mistakes and prevent judging a long-term asset by short-term performance snapshots.
Can I use the 3-3-3 Rule for a house flip?
It can inform risk thinking but is designed for rentals and phased hold decisions. A flip is primarily a short-duration execution and resale spread business. The three-month lens may still be useful for scope, burn rate, and timeline management, but the three-year and three-decade lenses will not map cleanly to a flip scenario.
What if capital expenditures are unpredictable? Does that break the framework?
No. It is exactly why the framework exists. The first three months reveal maintenance reality, and the first three years reveal repeatability. Use operating expense ratio benchmarks as a reference point and track expense drift explicitly rather than hoping it stays within original projections.
Does the rule work in high-cost markets with low initial cash flow?
Often yes, if you are intentional about the 30-year plan and have reserves for the three-month and three-year phases. Long-run rent growth context provides a tailwind, but you still need local underwriting and strong operations. A thin early cash flow supported by strong fundamentals and disciplined expense management is a different risk profile than a thin cash flow produced by poor underwriting.
Apply the 3-3-3 Rule to the deals you are already evaluating. Pick one property in your pipeline. Run the three-month stabilization stress test and a 12-month operating model. Set your three-year decision gate with explicit hold, refinance, and sell triggers. Use Shuk to track leasing performance, get predictive renewal insights, keep continuous marketing running, and monitor KPIs in analytics dashboards so each "3" is based on real performance rather than memory or projection.
Book a demo to see how the 3-3-3 workflow operates in Shuk and how the platform's renewal intelligence, continuous marketing, and performance tracking support each phase of the framework.

The 2% Rule for Rental Property: A Practical Screening Workflow for Self-Managing Landlords
The fastest way to lose money on a rental property is to overpay and hope the rent will make it work. Many independent landlords buy a property because it feels like a deal, only to discover that the mortgage, insurance, taxes, repairs, and vacancy eat up the rent. At that point, you are not building wealth. You are subsidizing a tenant.
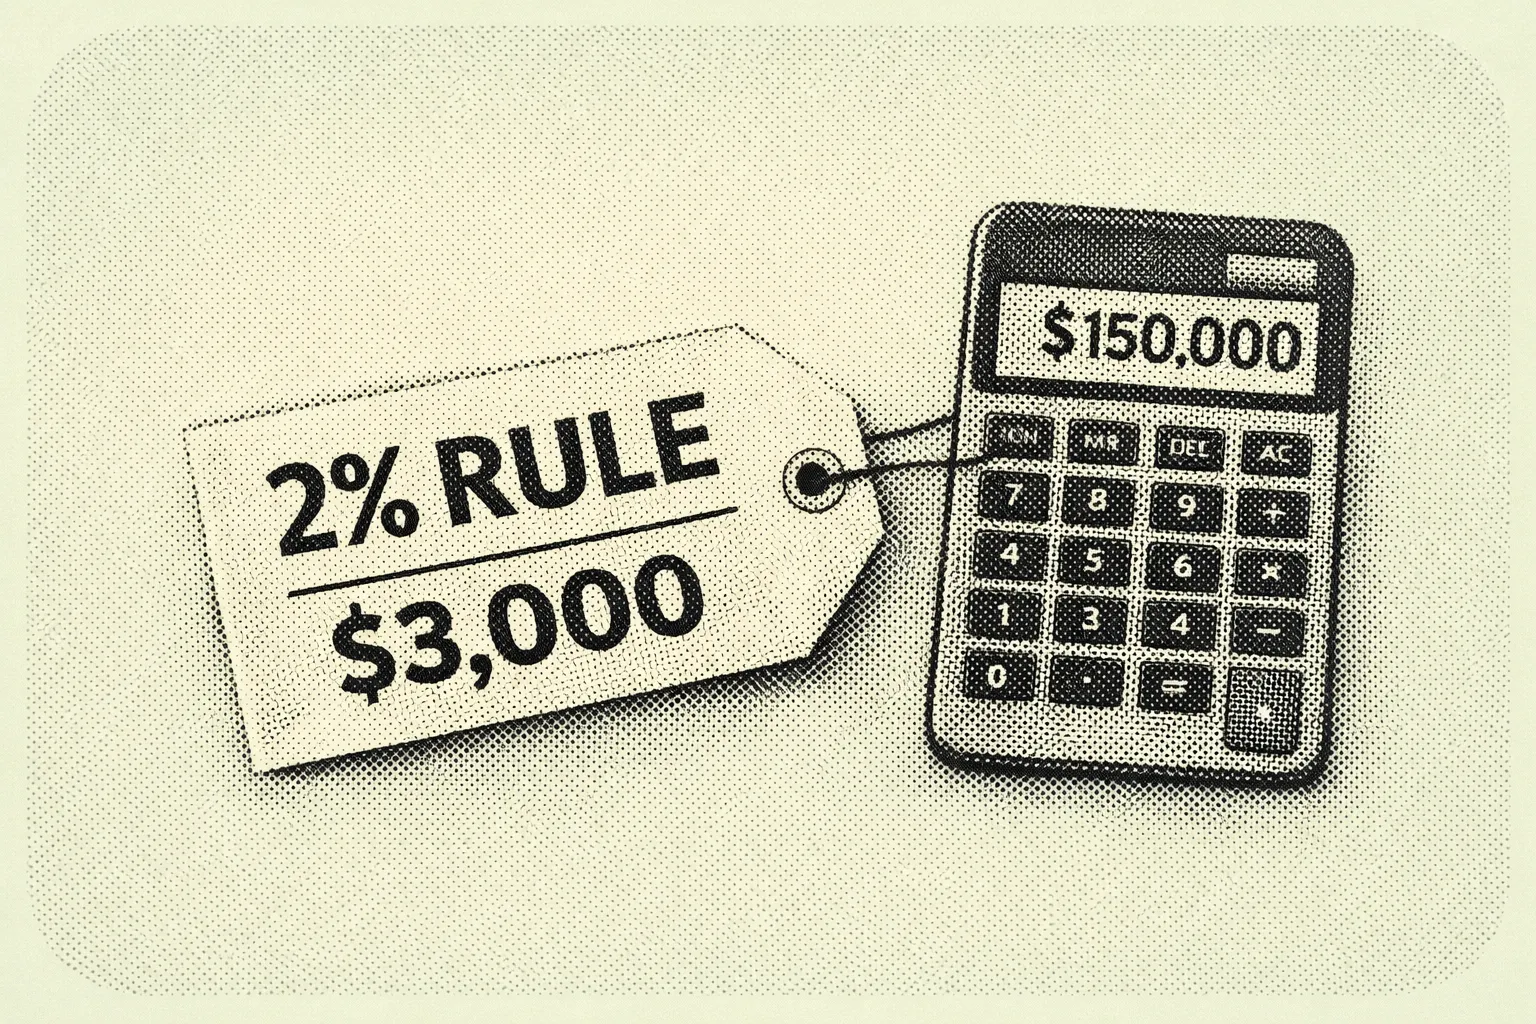
That is where the 2% rule comes in: a blunt, back-of-the-napkin screening metric designed to help small investors quickly filter out overpriced deals before spending hours on detailed analysis. In plain terms, it asks one question: does the monthly rent look high enough relative to the all-in purchase price to have a real chance at cash flow? A property passes if its monthly rent is at least 2% of the purchase price or total acquisition cost.
Here is an example. If a home costs $150,000, the 2% rule looks for $3,000 per month in rent. That is intentionally strict, and that is the point. In 2026, it is also harder to hit in many markets, which makes it even more useful as an early reality check before you fall in love with a listing.
What the 2% Rule Is and What It Is Not
The 2% rule is a quick screening heuristic: target monthly rent equal to approximately 2% of purchase price to suggest strong cash-flow potential. It became popular because landlords needed a fast way to compare dozens of listings without building a full spreadsheet for every one. The logic is simple: if rent is high relative to price, there is more room to cover operating costs, vacancy, financing, and still have money left over.
Here is what the rule does not do. It does not estimate your actual profit. It does not account for taxes, insurance, HOA fees, capital expenditures, tenant quality, or financing terms. Even prominent investing educators describe it as a quick guide and caution against relying on it alone. Many sources also note its practicality has declined in recent markets as prices rose faster than rents, pushing many good deals closer to 1% or less in high-cost metros.
If you self-manage or run a small portfolio, time is your most limited resource. The 2% rule helps you avoid overpaying when a property is clearly rent-constrained, compare neighborhoods quickly across different cities, and set a negotiating anchor. If rent comps support $1,200 per month, you can back into a 2% price ceiling of approximately $60,000 before rehab and closing costs.
In Cleveland, rents around $1,108 to $1,180 for a two-bedroom are documented in HUD Fair Market Rent data, while sale prices can be far lower than coastal cities, making high rent-to-price ratios more achievable. In San Francisco, the median sale price near $1.5 million makes 2%, which would require $30,000 per month, unrealistic for typical residential rentals. That gap is exactly what the rule is designed to reveal quickly.
Step-by-Step: How to Apply the 2% Rule Without Fooling Yourself
Step 1. Define the Numbers You Are Actually Using
The biggest mistake landlords make is applying the 2% rule to the list price and ignoring the real all-in cost. For practical screening, use:
All-in acquisition cost equals purchase price plus immediate rehab plus closing costs plus initial reserves.
Here is why this matters. Two $150,000 listings can produce very different results if one needs $25,000 in repairs.
Example A, simple calculation: Price $100,000, rent estimate $1,900 per month. Rent divided by price equals $1,900 divided by $100,000, which equals 1.9%. Close but not 2%.
Example B, all-in reality: Price $100,000 plus $15,000 rehab plus $5,000 closing equals $120,000 all-in. Rent divided by all-in cost equals $1,900 divided by $120,000, which equals 1.58%. No longer close.
Step 2. Calculate the Rule in Ten Seconds
Method one, the rent test: Monthly rent divided by all-in price must be greater than or equal to 0.02.
Method two, the price ceiling: Maximum all-in price equals monthly rent divided by 0.02, which is the same as monthly rent multiplied by 50.
That times-50 shortcut is useful during showings or calls with agents.
Example C, price ceiling in action: If rent comps support $1,400 per month, the 2% maximum all-in price equals $1,400 multiplied by 50, which equals $70,000. If the seller wants $95,000, you instantly know it fails the 2% screen unless there is a clear path to meaningfully higher rent.
Step 3. Build a Rent Estimate You Can Defend
Because the 2% rule depends entirely on the rent input, that number must be conservative. Use currently leased comparable properties when possible rather than active listings. Adjust for bed and bath count, parking, in-unit laundry, pets, and condition. Cross-check against public rent benchmarks such as HUD Fair Market Rent schedules for your area.
Example D, benchmark check: If you are underwriting a Cleveland two-bedroom at $1,450 per month but FMR benchmarks sit closer to $1,108 to $1,180, your 2% pass may be built on an overly aggressive rent assumption. The rule is only as reliable as the rent input supporting it.
Step 4. Run Three Outcome Scenarios
Scenario one, a pass with a Cleveland-style yield profile:
Cleveland has documented affordability and rent levels that can support stronger rent-to-price ratios than many high-cost metros.
All-in price: $80,000. Estimated rent: $1,200 per month. The 2% threshold rent needed is $80,000 multiplied by 0.02, which equals $1,600 per month. Actual ratio: $1,200 divided by $80,000 equals 1.5%.
This fails a strict 2% rule, yet many investors still pursue deals like this when expenses and financing are favorable. In today's market, a fail does not automatically mean bad. It means do not assume cash flow. Many sources emphasize pairing this rule with deeper analysis rather than using it as a final answer.
To improve this deal toward 2% without gambling: could you legally add value through an additional bedroom or finished space, reduce insurance and tax exposure, or negotiate a lower price? If not, treat it as a 1% to 1.5% style deal and underwrite accordingly.
Scenario two, borderline in Phoenix:
Phoenix had a median sale price around $461,000 in early 2024 data, with multifamily cap rate estimates around 5.6% in cited reports, suggesting tighter cash-flow conditions than lower-cost regions.
Purchase price: $350,000. Monthly rent estimate: $3,000. Ratio: $3,000 divided by $350,000 equals 0.86%. The 2% target rent for this price would be $7,000 per month.
This clearly fails 2%, but it is still a useful screen. It tells you Phoenix acquisitions may require a different strategy: a larger down payment, a different property type, mid-term rentals where legal, an appreciation focus, or a heavier value-add approach. In submarkets where 1% or less is the norm, pivot to a cap rate and cash-on-cash underwriting model rather than trying to force a 2% outcome.
Scenario three, a hard fail in San Francisco:
San Francisco's median sale price near $1.5 million makes the 2% rule a near-impossibility for conventional rentals.
Purchase price: $1,500,000. The 2% target rent would be $30,000 per month. Even at $7,500 per month in rent, the ratio would be 0.5%.
This is where the 2% rule shines as a screening tool. It prevents you from pretending a high-cost market purchase will cash flow like a Midwest rental. In these markets, you may still invest, but you should do so with eyes open around appreciation, tax strategy, and unique property types. Underwrite based on realistic rent-to-price dynamics rather than working backward from a target ratio that the market cannot support.
Step 5. Understand the Hidden Assumptions and Pair It With Companion Rules
Many 2% rule explanations implicitly rely on the idea that operating expenses plus vacancy may consume approximately 50% of rent. That is why investors pair the 2% rule as a rent-to-price screen with the 50% rule as an expense sanity check, then add a profitability metric such as cap rate or gross rent multiplier for comparisons.
The GRM connection is worth understanding. If monthly rent is 2% of price, annual rent is 24% of price, so the GRM equals approximately 4.17. A GRM that low is rare in most modern metro markets, which explains why true 2% deals are harder to find today and why investors who apply this rule strictly are effectively filtering for a shrinking segment of available inventory.
The bottom line strategy: use the 2% rule to discard obvious mismatches, then graduate the survivors into a full underwriting that includes expenses, vacancy, and financing.
The 2% Rule Rental Screen Checklist
Step 1, calculate all-in cost: Purchase price plus estimated closing costs plus immediate rehab and turn costs equals your all-in acquisition cost.
Step 2, estimate market rent conservatively: Check leased comparable properties, not just active listings. Cross-check active listing rents. Verify against a public benchmark such as HUD Fair Market Rent where relevant. Use the lower end of your range as your underwritten monthly rent.
Step 3, compute the ratio: Rent divided by all-in cost. The pass threshold is 2.0% or greater.
Step 4, classify the outcome: At or above 2.0% means a strong cash-flow candidate requiring expense verification. Between 1.0% and 1.99% means borderline, requiring excellent expense control and favorable financing. Below 1.0% means likely appreciation-driven, and you must be honest about the investment strategy before proceeding.
Step 5, add two reality checks before going further: Apply the 50% expense assumption as a rough filter to see whether cash flow is plausible after expenses. Compare using gross rent multiplier or cap rate for a more complete picture.
Two quick examples using the template: If rent is $1,180 and all-in cost is $120,000, the ratio is 0.98%, which is borderline or a fail depending on your threshold. If rent is $1,400 and all-in cost is $70,000, the ratio is exactly 2.0%, which passes and warrants full due diligence.
Frequently Asked Questions
Is the 2% rule realistic in high-cost markets?
Usually not. In very high-priced markets, home values are so large relative to rents that the 2% target becomes mathematically unrealistic. San Francisco's roughly $1.5 million median sale price implies approximately $30,000 per month in rent to hit 2%, which is not achievable for typical residential rentals. Many investing sources note the rule's practicality has declined as prices outpaced rents in most major metros. In these markets, use the rule to confirm the cash-flow math does not work rather than to find deals that pass.
How is the 2% rule different from the 1% rule?
They are the same concept with different strictness levels. The 1% rule is a looser screen and the 2% rule is a tougher cash-flow-first filter. As market conditions shifted and prices outpaced rent growth in many cities, many investors moved toward expecting closer to 1% or less in expensive regions. Experts consistently caution against using any percentage rule as a standalone decision tool rather than a first-pass filter.
Can I rely on gross rent alone when applying this rule?
No. Gross rent ignores operating costs, vacancy, and capital expenditures, which are exactly the limitations that make the rule useful only as a first-pass screen. Use it to eliminate obvious mismatches, then shift to expense-aware metrics like cap rate and to comparative tools like GRM once a property clears the initial filter.
What should I pair with the 2% rule for better decisions?
Pair it with a rough expense rule of thumb, commonly approximately 50% of rent, to test whether cash flow is plausible after expenses but before mortgage. Add cap rate for a more complete return picture and GRM for quick comparisons across listings. Together, these reduce the risk of approving a deal that looks good on rent but fails on real-world operating costs.
If you are self-managing rentals, the win is not memorizing one rule. It is building a repeatable screening workflow you will actually use when you are tired, busy, and tempted to overbid. Make the 2% rule your first filter, then document the survivors with a consistent process covering rent comps, all-in costs, vacancy and expense assumptions, and a cap rate and GRM cross-check.
Book a demo to see how Shuk's analytics and performance tracking tools support a consistent acquisition and operating workflow so every deal you evaluate is measured against the same standards.
What Is the 2% Rule in Rental Property?
When you self-manage a portfolio, even just a few units, the hardest part of buying a rental property is not finding listings. It is filtering dozens of maybe deals down to the few worth your time. Between listing photos, rough rent estimates, shifting interest rates, and market headlines, you can burn hours underwriting properties that were never going to cash flow.
That is why rent-to-price rules of thumb exist. They are not meant to replace real analysis. They help you triage: move quickly, rule out obvious mismatches, and focus your energy where you will get the best return. Among these quick filters, the 2% rule is the most aggressive.
The formula is simple. A property's monthly gross rent should be at least 2% of your total acquisition cost, meaning purchase price plus rehab. If you buy for $150,000 all-in, you would want $3,000 per month in rent.
The catch is that after post-2020 home price increases, the classic 2% benchmark is now rare in many U.S. metros, especially coastal and high-growth markets. That does not make it useless. It means you need to understand when it works, where it breaks, and what to do next once a property passes or fails the screen.
What the 2% Rule Is and What It Is Not
The 2% rule is a rent-to-cost test: a quick rental income metric that compares gross monthly rent to what you invested to acquire the property. Most definitions specify total acquisition cost as purchase price plus rehab needed to get the unit rent-ready. In real-world underwriting, you will often also want to consider closing costs, initial leasing costs like paint and lock changes, and immediate safety or code items.
The higher the monthly rent is relative to what you paid, the more room you typically have to cover operating expenses including taxes, insurance, repairs, vacancies, and property management, and still produce cash flow. That is why percentage rules became popular among cash-flow investors in lower-cost Midwestern markets and why they have been widely discussed in landlord education communities since the early 2000s.
Here is what the 2% rule does not do. It does not account for local expense structures, which can vary dramatically by county and state. It does not incorporate financing terms including interest rate, down payment, or loan structure. It does not measure profitability directly because it ignores vacancy, maintenance, capital expenditures, and tenant turnover. And it does not capture appreciation expectations, which research has shown can be a major component of long-run returns.
Because of those omissions, the 2% rule is a fast smell test, not a full inspection. Use it as a starting filter, then validate the deal with expense-based metrics like cap rate, cash flow projections, and debt service coverage analysis.
How to Use the 2% Rule Without Fooling Yourself
Step 1. Start With the Exact Formula and Define Your All-In Cost Up Front
The calculation is straightforward.
Rent-to-cost ratio = Monthly gross rent divided by total acquisition cost.
A property meets the 2% rule if monthly gross rent is at least 2% of total acquisition cost.
Run the metric two ways for consistency. The core test uses purchase price plus rehab, which aligns with the most common definition. The conservative test adds estimated closing costs and initial leasing expenses, which is closer to your true cash invested. Rules of thumb are already blunt instruments. If your inputs vary deal to deal, the rule produces noise instead of signal.
Step 2. Use Current Market Anchors to Set Realistic Expectations
The biggest reason landlords get discouraged by the 2% rule is that they apply it in markets where it is structurally unlikely. Recent Zillow data illustrates why this matters.
Los Angeles shows average home values near $941,985 and average rents around $2,658, producing a rent-to-value ratio of roughly 0.28% per month. Seattle shows average home values near $848,869 and average rents around $2,258, producing roughly 0.27% per month. Indianapolis shows average home values near $223,231 and average rents around $1,463, producing roughly 0.66% per month. Cleveland shows average home values near $113,669 and average rents around $1,250, producing roughly 1.10% per month. Tampa shows average home values near $369,079 and average rents around $2,213, producing roughly 0.60% per month.
These are broad metro averages, not deal-specific comps. But they illustrate a critical point: the same 2% threshold implies dramatically different feasibility depending on local prices, rent ceilings, and supply and demand conditions.
Instead of asking whether a market meets 2%, ask what rent-to-cost ratios are typical there, and if 2% is unrealistic, what threshold reliably indicates a workable cash-flow candidate. Many modern investor discussions treat 1% or even 0.8% as more realistic in many areas, while still using 2% as a home-run screen in low-cost or distressed value-add contexts.
Step 3. Run the Calculation Step-by-Step: A Midwest Value-Add Example
A landlord finds an older house in the Cleveland area priced below the broader metro average, needing moderate rehab.
Purchase price: $95,000. Rehab to rent-ready: $15,000. Total acquisition cost: $110,000. Expected monthly gross rent: $1,950.
Dividing $1,950 by $110,000 produces a ratio of 1.77% per month. To meet the strict 2% rule, the property would need $2,200 per month in rent.
This property fails the 2% threshold, but it is close. In many real-world scenarios, a 1.7% to 1.8% ratio may still be worth full underwriting, especially if the rehab estimate is tight, tenant demand is strong, and the neighborhood risk profile fits your management capacity. Cleveland's broader metro average produces about 1.10% rent-to-value. A deal at 1.77% is significantly above that average, suggesting a favorable purchase basis, above-average achievable rent, or both. That is often what a good deal looks like in a low-cost market: you are outperforming the typical rent-to-price relationship, not chasing a mythical 2% in every zip code.
Step 4. Contrast With a High-Cost Coastal Market
A landlord evaluates a small duplex in Los Angeles with strong tenant demand but a high acquisition cost.
Purchase price: $950,000. Rehab and turnover work: $25,000. Total acquisition cost: $975,000. Expected monthly gross rent for both units combined: $5,400.
Dividing $5,400 by $975,000 produces a ratio of 0.55% per month. To meet the 2% rule, the property would need $19,500 per month in gross rent, which is far beyond typical long-term rents for most small multifamily properties in any market.
In coastal markets, investors often justify acquisitions through a different return mix: lower current yield paired with potential long-term appreciation, rent growth, tax advantages, and inflation hedging. Academic work on rent-price dynamics confirms that expected capital gains can heavily influence buying behavior even when rent ratios are low. That is precisely why simplistic ratios can mislead if treated as universal laws rather than market-relative tools.
Step 5. Compare the 2% Rule to the 1% Rule
The 1% rule is the more commonly cited version: monthly gross rent should be at least 1% of total acquisition cost. It became widely popular through mainstream landlord education and investor communities and is generally treated as a first-pass filter before deeper underwriting.
The practical difference comes down to thresholds. The 2% rule is a very high bar, often indicating a low purchase price relative to rent, significant distress or value-add, or a higher-risk area where prices are low for a reason. The 1% rule is still a strong quick screen in many markets but is challenging in most coastal metros given current pricing.
Use both as a funnel. If a deal meets 2%, treat it as a priority but scrutinize neighborhood quality, tenant demand, and deferred maintenance, because too good can mean hidden risk. If it meets 1% but not 2%, underwrite it because it may still cash flow depending on expenses and financing. If it fails 1%, do not automatically discard it in expensive markets, but require a strong alternative thesis: appreciation potential, development optionality, ADU value, or a clear repositioning plan.
Step 6. Cap Rate Versus the 2% Rule: What Each Metric Tells You
Both metrics compress a deal into a single number, but they answer different questions.
The 2% rule uses gross monthly rent and acquisition cost, ignores expenses and financing, and is best as a fast screening tool. Cap rate uses net operating income divided by purchase price, which means it reflects operating reality more accurately because it accounts for taxes, insurance, repairs, management, and other operating costs. Cap rate still ignores financing, but it captures the expense differences that the 2% rule cannot see.
Two properties can have identical gross rent and identical acquisition cost but wildly different cap rates if one sits in a high-tax county, a higher-insurance region, or a property with major capital expenditure coming due. A practical workflow for self-managing landlords: use the 2% or 1% rule to filter, then estimate a quick cap rate to sanity-check the operating story, then run full financing and cash flow projections including cash-on-cash return, debt service coverage, and stress tests.
Step 7. Add Market and Property-Type Nuances
Property taxes and insurance can break a deal that passes the 2% screen. Expense structures vary by location and are not captured in a gross-rent ratio. Never buy the ratio without validating expenses first.
Post-2020 pricing has made 2% rare in many markets. Many landlords now operate with a tiered target: 2.0% as exceptional, typically limited to value-add, distressed, or very low-cost market scenarios; 1.0% to 1.5% as the more common cash-flow hunting range in many non-coastal markets; and 0.5% to 0.9% as common in high-cost metros requiring a different investment thesis.
Property type also matters. A duplex or fourplex may produce more rent per dollar of purchase price than a comparable single-family in the same neighborhood. Some high-demand single-family neighborhoods command a rent premium, but purchase prices often outpace rents, pushing ratios down. Broad Zillow averages in Los Angeles and Seattle confirm this dynamic at the metro level.
2% Rule Quick Screen Template
Use this when scanning listings or reviewing off-market leads. Apply the same inputs and the same math consistently so you do not treat deals differently based on how much you like them.
Inputs: Purchase price. Rehab to rent-ready. Closing and initial leasing costs (optional but recommended). Projected monthly gross rent.
Calculations: Core all-in cost equals purchase price plus rehab. Core rent-to-cost ratio equals monthly rent divided by core all-in cost. Conservative all-in cost adds closing and initial costs. Conservative rent-to-cost ratio equals monthly rent divided by conservative all-in cost.
Decision rules: At 2.0% or above, flag as priority and proceed to full underwriting, but scrutinize neighborhood quality, deferred maintenance, and confirmed rent comps. Between 1.0% and 1.99%, underwrite the deal because it may be viable depending on expenses and financing. Below 1.0%, proceed only with a clear alternative thesis covering appreciation, redevelopment potential, exceptional rent growth, or a positioning plan that supports the acquisition at that price.
Next numbers to pull before making an offer: Rent comps for the same bedroom and bathroom count in similar condition. Taxes and insurance estimates using local sources rather than national averages. A rough annual expense budget covering maintenance, reserves, and vacancy. A quick cap rate calculation to compare against what the rent-to-cost ratio suggests.
Frequently Asked Questions
Is the 2% rule still realistic in 2026?
In many U.S. markets, especially high-cost coastal metros, the traditional 2% rule is rarely achievable for standard long-term rentals because prices have outpaced rent growth. Zillow's broad metro data illustrates the gap clearly: in Los Angeles, average home values near $941,985 paired with average rents around $2,658 produce a rent-to-value ratio far below 1%, let alone 2%. That said, 2% can still appear in specific situations including distressed purchases, heavy value-add rehabs, low-cost neighborhoods, and certain rental operations. Use it as a home-run screen rather than a universal expectation.
Does meeting the 2% rule guarantee positive cash flow?
No. The 2% rule is based on gross rent and acquisition cost and ignores operating expenses and financing entirely. A property can pass the screen and still cash flow poorly if taxes, insurance, maintenance, utilities, or turnover costs are high, or if financing terms are unfavorable. Treat it as the first filter, then validate the deal with expense-based metrics like cap rate and a full financing-based cash flow model.
What is the difference between the 1% rule and the 2% rule?
They are the same concept with different thresholds. The 1% rule says monthly gross rent should be at least 1% of total acquisition cost. The 2% rule uses 2% and is therefore much stricter. In today's pricing environment, many investors view 1% as challenging but sometimes workable in lower-cost markets, while 2% is often limited to unusually strong cash-flow deals or higher-risk areas.
If my market cannot hit 1% or 2%, what should I use instead?
Do not force a national rule onto a local market. In expensive metros, broad market data shows rent-to-value ratios closer to a fraction of 1% at the metro level. In those environments, shift your screening toward realistic cap rate estimates, conservative cash flow after financing, and a clearly articulated long-term thesis covering appreciation, rent growth, and repositioning potential. Percentage rent rules do not capture expected capital gains, which research confirms can be a major driver of investor returns in high-cost markets.
If you want to track rent-to-cost ratios alongside the operating metrics that actually drive long-term performance, book a demo to see how Shuk helps landlords monitor income trends, vacancy, and portfolio health from one place.

The 3-3-3 Rule in Real Estate: A Practical Framework for Evaluating Rentals Over 3 Months, 3 Years, and 3 Decades
Most rental property mistakes do not come from bad intentions. They come from using the wrong time horizon. A first-time landlord buys a cash-flowing duplex, then panics when the first month includes a vacancy, a plumbing surprise, and a slower-than-expected lease-up. A small-portfolio owner rejects solid properties because they do not hit a quick-rule benchmark like the 1% rule, only to realize later that modest early cash flow can become strong wealth-building over time. And many self-managing landlords underestimate the 30-year compounding effect of amortization, rent growth, and inflation working together.
The 3-3-3 Rule is an investor-driven heuristic that forces you to evaluate a rental the way it actually performs: in phases. The framework adapts the spirit of a widely used real estate discipline tool into a time-horizon evaluation system built around three distinct windows.
The first 3 months ask whether you can stabilize operations and validate the underwriting assumptions. The first 3 years ask whether you can prove the asset's economics through occupancy, rent strategy, expense control, and refinance or sell options. And 3 decades ask whether the property meaningfully builds net worth through amortization, inflation-adjusted rent growth, and long-run appreciation.
Before you buy or sell a rental, the most important question is which of the three horizons you are optimizing for and which ones you are willing to temporarily underperform.
What the 3-3-3 Rule Is and Why It Works
The 3-3-3 Rule is best understood as a practical, investor-driven framework that improves decisions by forcing time-based thinking rather than a snapshot evaluation. Each horizon aligns to a real operational reality.
The 3-month window is the stabilization window. Many properties take time to reach operating rhythm: marketing, pricing, turns, vendor relationships, and tenant experience all get established in the early period. The noise in this window is high and the signal is low, which is why evaluating a property based solely on the first quarter is one of the most common and expensive analytical mistakes.
The 3-year window is the proof-of-model window. Three years is long enough to experience at least a couple of renewal and turnover cycles, to see whether expense patterns match underwriting assumptions, and to evaluate whether your rent strategy aligns with local market conditions. It is also far enough from acquisition to separate what was temporary friction from what reflects the actual economics of the asset.
The 3-decade window is the wealth window. This is where amortization, long-term appreciation, and inflation-adjusted rent growth drive the majority of lifetime returns. Research on single-family rental total returns shows that both income yield and price appreciation contribute meaningfully to long-run performance, and that multi-decade ownership allows those two components to compound in ways that short-term evaluation frameworks simply cannot capture.
Recent market data illustrates why short-term snapshots mislead. National home prices rose 4.5% year-over-year in the FHFA's Q4 2024 House Price Index, a meaningful figure that varies significantly by market and can shift quickly. Rent growth cooled nationally, with Zillow reporting 1.0% year-over-year growth in December 2024 and noting broader cooling tied to new supply. The national rental vacancy rate reached 6.9% in Q4 2024 and 7.2% in Q4 2025. None of these data points tells you whether a specific property is a good investment. The 3-3-3 framework is the mechanism for integrating them across the right time windows.
How to Apply the 3-3-3 Rule: Seven Steps
Step 1. Set Your Goals for Each Horizon Before You Underwrite the Deal
Start by defining what success means in each window, because the same property can look problematic in one horizon and excellent in another.
For the 3-month horizon, success means reaching target occupancy, confirming market rent, establishing a repair baseline, and verifying that operating expenses are realistic. For the 3-year horizon, success means consistent occupancy near your underwriting assumptions, predictable maintenance and capital expenditure planning, and reliable net operating income trends. For the 3-decade horizon, success means meaningful equity growth through principal paydown and appreciation, combined with rent income that rises with inflation over time.
Write down three metrics you will track for each horizon before running the numbers. Without that commitment, you will gravitate toward whichever metric makes the deal feel right in the moment.
Step 2. Underwrite the Deal with Horizon-Specific Metrics Rather Than a Single ROI Number
A common underwriting mistake is using one profitability number to represent a property across all time windows. The 3-3-3 Rule asks for three separate scorecards.
The 3-month scorecard covers expected days-to-lease and occupancy ramp, initial repair and turn costs, and cash reserves sufficient to absorb the vacancy buffer that national data suggests should never be assumed away.
The 3-year scorecard covers net operating income trend and expense drift, vacancy and turnover assumptions built on realistic data rather than optimism, and rent growth assumptions informed by current national trends rather than peak-cycle figures.
The 3-decade scorecard covers mortgage amortization and the equity paydown it produces, long-term appreciation using conservative assumptions grounded in indices like the FHFA House Price Index, and inflation context from CPI data that helps separate nominal gains from real purchasing-power improvement.
Keep three separate assumption sets: stabilization, 3-year operations, and 30-year wealth. Pricing a long-term asset like a short-term trade is one of the most reliable paths to disappointment.
Step 3. Stress-Test the First 3 Months: Stabilization, Systems, and Surprises
The first 90 days are where execution matters most. The goal is not perfection. It is getting to a predictable operating rhythm as efficiently as possible.
Track four things in the first three months: actual rent collected versus projected, vacancy days and leasing funnel performance, maintenance responsiveness and first-wave repair costs, and tenant screening quality as a driver of early stability. Early pain is common and expected. Persistent variance after the stabilization window closes is the real signal to investigate.
Treat months one through three like onboarding a new business unit. If you are not tracking variance between projected and actual performance, you cannot distinguish between a property problem and a process problem.
Step 4. Validate the 3-Year Model: Occupancy, Rent Strategy, and Expense Reality
Three years is long enough to reveal whether you have built a resilient rental rather than a lucky first year. During this window, you typically experience at least two renewal or turnover events. Turnover carries real costs ranging from roughly half a month to several months of rent depending on repairs, vacancy, and leasing expenses. These costs significantly affect whether the operating economics match what you underwrote.
Market rent and rent growth can also change direction over a three-year period. Zillow data confirms that rent growth can slow and decline from peaks, reinforcing the need for medium-term analysis rather than extrapolating from a single favorable year.
By year three, you should be able to measure average annual cash flow and cash-on-cash trend, occupancy and average days-to-lease, maintenance and capital expenditure averages separated into recurring and one-time categories, and the relationship between rent increases and tenant retention rates.
Step 5. Plan the Year-Three Decision: Hold, Optimize, Refinance, or Sell
The 3-year mark is a natural decision point because it is far enough from acquisition to reduce noise and early enough to pivot before complacency sets in. Put a calendar reminder at acquisition to run a hold, refinance, or sell analysis at the three-year mark rather than letting it arrive without a plan.
At year three, evaluate whether the asset is stabilized and performing as expected, whether a renovation, rent repositioning, or operational upgrade would meaningfully change net operating income, and whether holding, refinancing, or selling best serves the portfolio. If operational optimizations around expense control and tenant retention have been the primary levers, the year-three decision should also reflect whether those improvements are sustainable or have been fully captured.
Step 6. Model 3 Decades: Inflation, Amortization, Appreciation, and Planning Assumptions
The 30-year lens is where rental properties often outperform expectations because time compounds in your favor. It also requires more disciplined modeling than shorter-horizon analysis, because small assumptions about rent growth, vacancy, and appreciation compound into large differences in the projected outcome.
The four key long-horizon drivers are amortization, where tenants effectively help pay down principal over time; appreciation, which FHFA data shows has been positive nationally over multi-decade periods even with year-to-year volatility; rent growth, which should be modeled conservatively against current national trends rather than peak-cycle performance; and vacancy cycles, which national data confirms are never zero and should be built into any 30-year projection.
The 3-3-3 Rule offers a meaningful advantage over popular quick rules like the 1% rule, 2% rule, and 50% expense rule. Those tools are useful for fast screening but blunt as decision frameworks. They do not address stabilization timing, turnover cost, financing structure, or multi-decade wealth building. The 3-3-3 framework forces evaluation across phases rather than a single snapshot, which is how rental properties actually perform.
Your 30-year model should include a conservative rent growth rate, a vacancy allowance grounded in national data, and periodic capital expenditure. If the wealth outcome still meets your goal under those conservative assumptions, the asset is far more likely to deliver.
Step 7. Track the Right KPIs Continuously Across All Three Horizons
The 3-3-3 Rule only works if you can measure what matters without drowning in spreadsheets or losing the data between review cycles.
For the 3-month stabilization window, track rent collected versus scheduled, vacancy days, make-ready costs, and maintenance response time. For the 3-year performance window, track cash flow trend, net operating income trend, turnover frequency and cost, and occupancy rate. For the 3-decade wealth window, track equity growth through principal paydown and market value, appreciation in context of indices like the FHFA, and rent projections that are periodically updated to reflect current market reality.
When your metrics are organized by property and by time window, the 3-3-3 Rule stops being a concept and becomes a repeatable decision system.
3-3-3 Evaluation Template
Use this template for acquisitions you are considering or to evaluate a property you already own. Fill in the projected columns using conservative assumptions before closing, then update with actual results monthly during the first three months, quarterly through year three, and annually thereafter.
3 Months: Stabilization
Target occupancy date. Leasing plan covering marketing channels and showing process. Make-ready budget per unit. First-90-day cash reserve target covering mortgage, utilities, and repairs. KPI targets: collected rent as a percentage of scheduled, vacancy days, and maintenance response time.
3 Years: Proof of Performance
Average annual cash flow target. Occupancy target with a vacancy allowance built in using national data as a floor. Turnover assumption and estimated cost per turnover event. Annual rent increase assumption set conservatively against current market conditions. Year-three decision trigger chosen in advance from the options of hold, optimize, refinance, or sell.
3 Decades: Wealth Building
Long-run rent growth assumption in nominal terms. Inflation assumption for a real return view using CPI as a sanity check. Long-run appreciation assumption contextualized with FHFA trends and kept conservative. Equity milestones at years ten, twenty, and thirty. Lifestyle risk plan covering job loss, major repairs, and market downturns.
If the deal only looks good in one horizon, you now know exactly what risk you are accepting.
Frequently Asked Questions
Is the 3-3-3 Rule a formal industry standard or a heuristic?
It is best understood as a practical heuristic rather than a formal standard. The time-horizon version covering 3 months, 3 years, and 3 decades is an investor-friendly adaptation that aligns with how rentals actually behave: stabilize first, prove performance next, compound wealth last. The value is in the discipline it creates, not in the authority of its origin.
How does the 3-3-3 Rule compare to the 1% rule, 2% rule, and 50% expense rule?
Those quick rules are screening tools rather than full evaluation frameworks. They help sort listings quickly but can reject good long-term assets or approve risky ones. The 3-3-3 Rule differs because it separates early volatility from stabilized performance, forces realistic vacancy and turnover assumptions into the model, and emphasizes multi-decade wealth drivers that snapshot metrics cannot capture. Use quick rules to shortlist. Use the 3-3-3 framework to decide.
What metrics matter most in each horizon for small landlords?
For 3 months, the most useful metrics are collected rent as a percentage of scheduled rent, vacancy days, make-ready spend, and maintenance turnaround time. For 3 years, track average annual cash flow, occupancy rate, and turnover frequency and cost. For 3 decades, track equity growth, long-run rent projections adjusted for current market conditions, appreciation in context of index data, and inflation-adjusted purchasing power using CPI as a reference.
What if the first 3 months look bad? Does that mean the deal was a mistake?
Not necessarily. The first 90 days often reflect stabilization friction: vacancy during unit turns, one-time repairs, and operational setup. The key distinction is whether the result is explainable and fixable through execution or whether it reflects a structural mismatch between rent and expense that will persist regardless of how well the property is managed. Early pain is common. Persistent variance after stabilization closes is the signal to investigate seriously.
Want to see how Shuk helps landlords track performance across each of these horizons, from first-90-day variance to year-over-year NOI trends? Book a demo and walk through how rent collection, maintenance tracking, and lease renewal tools work together for landlords managing 1 to 100 units.
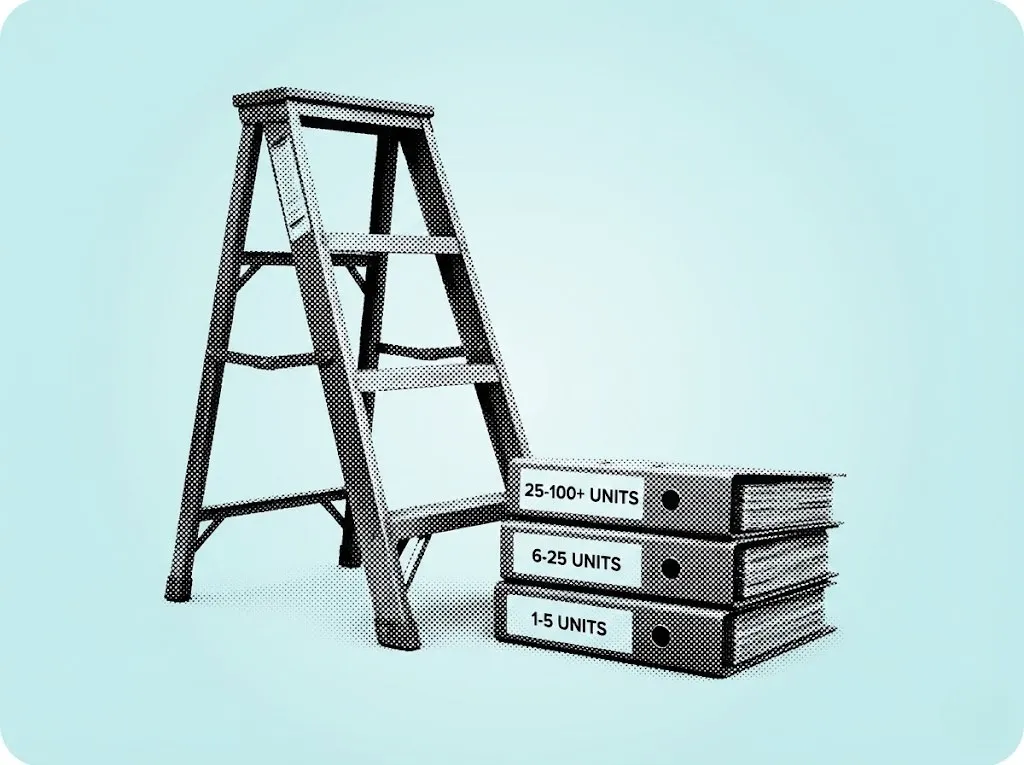
How to Scale a Rental Property Portfolio From 1 Unit to 10, 25, or 100+ Without Losing Control
What Scaling a Rental Property Portfolio Means and Why Most Landlords Stall
Scaling a rental property portfolio is the process of growing from a small number of rental units to a larger, systematized operation by layering repeatable acquisition strategies, scalable financing structures, and standardized management systems. It requires progressing through distinct phases where the bottlenecks shift from deal-finding to capital access to operational discipline. For independent landlords and small property managers, the difference between controlled growth and chaotic expansion comes down to whether systems are built before they are needed.

First Rental Property Mistakes: How to Evaluate Deals, Finance Smart, and Manage Without Surprises
What First-Time Rental Property Investor Mistakes Are and Why They Matter
First-time rental property investor mistakes are the recurring errors new landlords make during property evaluation, financing, and ongoing management that turn otherwise reasonable deals into cash-flow problems. These mistakes are predictable and largely preventable with disciplined underwriting, conservative financing assumptions, and repeatable management systems. For independent landlords and small property managers, avoiding these early missteps is the difference between building a portfolio and funding a liability.
Why First Rentals Fail in Practice
Buying your first rental property can feel straightforward: find a property, collect rent, pay the mortgage, repeat. But the gap between "it looked good on paper" and "it cash-flows in real life" is where most mistakes happen.
Vacancy is real, and it is not evenly distributed. The U.S. Census Bureau reported single-family rental vacancy at 5.3% in Q1 2024 while larger multifamily of 5 or more units ran higher at 7.8%, with the overall national rental vacancy rate at 6.6% in the same period. If you are undercapitalized or over-leveraged, just one vacancy stretch plus a repair can turn your passive income plan into a monthly cash call.
Add financing pressure. DSCR lending commonly looks for roughly 1.25 or higher for better terms, with typical investor LTV caps around 75% to 80% meaning 20% to 25% down. Rates in the mid-to-high single digits have been common in recent investor-loan pricing. If you do not stress-test those terms, the deal may only work on a spreadsheet with perfect assumptions.
Three scenarios you will recognize.
Accidental landlord. You move for work, rent out your old home, and discover that maintenance and turnover eat the extra money you expected.
DIY landlord. You self-manage to save fees, but inconsistent screening creates late payments and expensive evictions. The highest-cost landlord problems are usually preventable process failures.
Small-portfolio owner. You buy a duplex assuming expenses are maybe 20%, then learn why many small multifamily underwriters view 35% to 45% expense ratios as a healthier range.
What a Strong First Rental Requires
A strong first rental is less about finding a great deal and more about building a repeatable decision system. That system has three parts.
Property Evaluation
You are trying to estimate net operating income and risk accurately. Market metrics help, but they do not replace property-specific diligence. Industry reporting has shown multifamily NOI growth of 5.9% in 2024 while rental income grew 8.7% from the prior year. That sounds encouraging until you realize NOI is what is left after expenses, and expenses are exactly what new investors undercount.
Financing
Investor loans are not the same as a primary-home mortgage. DSCR expectations, down-payment requirements, and rate variability can make your monthly payment significantly higher than expected. Your goal is not to get approved. Your goal is to ensure the property can carry debt through real-life events: vacancy, repairs, property tax changes, and insurance increases. Those are the four most common post-closing surprises cited by new landlords.
Ongoing Management
Self-management can be profitable, but only if you treat it like an operations role. The first-time trap is to improvise: casual screening, inconsistent leases, no maintenance reserve, and no vendor list. National benchmarking work in the property-management industry emphasizes navigating elevated costs in a constrained operating environment. You need a plan, not just good intentions.
The 9 Mistakes and How to Avoid Each
Mistake 1. Trusting "Rent Minus Mortgage" Instead of Underwriting NOI
What it is. You judge a deal by whether rent covers the mortgage, ignoring true operating expenses including taxes, insurance, maintenance, management, turnover, utilities, and admin.
Why it happens. You are used to personal budgeting, not business accounting. Many listing pro formas also omit or minimize real expenses.
Example. A DIY landlord buys a single-family rental expecting slim but positive cash flow. They budget $50 per month for repairs. In practice, average single-family maintenance has been cited around $137 per month, with older homes higher. The cash flow disappears.
How to avoid it.
Build an NOI worksheet: gross scheduled rent, subtract vacancy, subtract operating expenses, equals NOI. Compare your expenses to benchmarks. Small multifamily underwriting often lands in the 35% to 45% expense ratio range. Treat listing numbers as starting points, not truth. Verify taxes, insurance quotes, utility responsibility, and trash and water billing rules before you close.
Real example. A first-time duplex buyer used the seller's $1,200 per year maintenance line item. Year one included a water-heater failure and plumbing leak. The deal survived only because they had extra savings. Survived is not the same as performed.
Mistake 2. Underestimating CapEx
What it is. You budget for small repairs but not major replacements including roof, HVAC, sewer line, and windows.
Why it happens. CapEx is lumpy and emotionally easy to ignore. New investors also confuse "inspection passed" with "no future replacements."
How to avoid it.
Create a CapEx schedule listing roof age, HVAC age, water heater, major appliances, and exterior paint. Estimate remaining useful life by asking your inspector and requesting permit history where available. Convert to monthly reserves: total CapEx expected over 10 years divided by 120 months equals your monthly CapEx reserve. Negotiate with evidence. If the roof is near end-of-life, ask for a credit or price reduction supported by contractor estimates.
Real example. An accidental landlord rents out their former home. Two years later HVAC dies in July. They finance the replacement at a high rate because they did not build reserves. The rental income becomes a payment plan.
Mistake 3. Using the Wrong Vacancy Assumption
What it is. You assume 0% vacancy because you already have a tenant lined up or because the area feels tight.
Why it happens. Optimism bias and recency bias. If your unit is occupied now, you assume it stays occupied.
How to avoid it.
Underwrite vacancy as an annual percentage. Start with 5% to 8% depending on property type and your market, then adjust using local comps. Add a turn cost line item covering cleaning, paint, minor repairs, marketing, and lost rent during make-ready. Track days-to-lease in your neighborhood by watching listings weekly for 60 days before buying.
Real example. A first-time investor buys a small multifamily assuming it will rent in a week. Turnover takes 45 days due to poor photos and slow maintenance coordination. The lost rent plus utilities wipe out three months of profit.
Mistake 4. Misreading Cap Rates and Overpaying for "Safe" Cash Flow
What it is. You buy based on cap rate headlines or assume a lower cap rate always means better without tying it to real NOI quality.
Why it happens. Cap rate is easy to compare but easy to misuse.
How to avoid it.
Calculate cap rate yourself from verified NOI, not broker NOI. Run cap rate sensitivity: what happens if expenses rise 10%? What if rent is 5% lower than projected? If that breaks the deal, it is fragile. Do not confuse cap rate with cash-on-cash return. Financing terms can turn a decent cap rate into poor cash flow.
Real example. A buyer paid a premium price for a turnkey rental at a low cap rate. Insurance renewal came in far higher than expected. Cap rate was irrelevant because the mortgage stayed fixed but expenses did not.
Mistake 5. Not Stress-Testing Financing
What it is. You get a quote, assume it holds, and buy a deal that only works under best-case terms.
Why it happens. Many first-timers shop property first and financing second.
How to avoid it.
Underwrite with a rate shock buffer. Add 0.5% to 1.0% to the quoted rate and see if you still cash flow. Confirm DSCR calculation method since some lenders use gross rent and others use appraiser market rent. Clarify early. Keep liquidity: plan for down payment plus closing plus 3 to 6 months of reserves.
Real example. A small-portfolio owner planned 80% LTV but the lender capped at 75% due to property type. They scrambled for cash, closed anyway, and drained reserves. Then they faced immediate plumbing repairs.
Mistake 6. Confusing Low National Delinquency With Deal Safety
What it is. You rely on rosy macro indicators and ignore property-level risk.
Why it happens. Headlines can sound reassuring.
How to avoid it.
Build a bad year model: assume one month vacancy plus one major repair plus 5% rent drop and confirm you can pay the mortgage. Avoid thin deals. If your monthly cushion is under 5% to 10% of rent, you are one event away from negative cash flow. Add landlord insurance and require renters insurance to reduce liability and claims risk.
Real example. An accidental landlord assumed defaults are low so rentals are stable. Their tenant paid late repeatedly. Without strict enforcement and reserves, the landlord started covering the mortgage with credit cards.
Mistake 7. Underbudgeting Maintenance
What it is. You treat maintenance as occasional, not continuous.
Why it happens. New owners focus on the purchase, not the operation.
Single-family rentals have been cited at roughly $137 per month average maintenance, rising with property age. National benchmarking has reported average multifamily maintenance expenses around $8,657 per unit annually in 2024.
How to avoid it.
Budget maintenance as a line item from day one, not leftover money. Set service standards including response time, approval limits, and vendor expectations. Build a vendor bench before you need it: plumber, electrician, HVAC, handyman, and locksmith.
Real example. A DIY landlord tried to do everything personally to save money. After-hours calls, travel time, and rushed repairs caused tenant churn, creating vacancy losses bigger than any management fee.
Mistake 8. Weak Tenant Screening
What it is. You rent based on vibes, urgency, or a partial application.
Why it happens. You fear vacancy and want rent coming in fast.
How to avoid it.
Set written screening criteria including income multiple, credit threshold or explanations allowed, rental history, and criminal policy consistent with local laws. Verify income through pay stubs and employer verification and call prior landlords, not just the current one. Use a consistent process for every applicant to reduce fair-housing risk.
Real example. A first-time landlord accepts a tenant who offers to pay cash upfront but will not provide verifiable employment. Three months later, payments stop. The fast fill becomes months of loss.
Mistake 9. Managing Without Systems
What it is. You operate ad hoc with no reserve policy, no documentation, and no calendar for inspections and renewals.
Why it happens. You think one property does not need infrastructure.
How to avoid it.
Create a simple ops calendar covering lease renewal outreach, filter changes, seasonal HVAC service, and annual smoke and CO checks. Use separate bank accounts and track property-level P&L monthly. Establish reserve targets for maintenance, CapEx, and vacancy. Tie reserves to rent so they scale.
Real example. A small-portfolio owner did not track expenses by property. One unit silently underperformed for 18 months. They only noticed when taxes and insurance jumped and cash got tight.
Pre-Close and First 90 Days Checklist
Use this as your operating checklist. It is designed to prevent the most common first-time rental property investor mistakes by forcing you to verify numbers, stress-test financing, and set up management systems.
Deal Evaluation and Underwriting (Pre-Offer)
Rent validation. Pull 5 to 10 comparable rentals and document rent, days listed, and concessions. Underwrite vacancy using Census reference points with single-family at 5% or higher and multifamily higher.
NOI verification. Confirm property taxes from assessor records. Get an insurance quote before making an offer. Use an expense ratio reality check with 35% to 45% as a healthier range for small multifamily.
CapEx plan. List ages for roof, HVAC, water heater, and appliances. Convert expected replacements into a monthly CapEx reserve. Request seller receipts and permits where possible.
Financing Stress-Test (Pre-Close)
Confirm DSCR target and calculation method, aiming to clear roughly 1.25 or higher if possible. Confirm max LTV of 75% to 80% and required down payment. Underwrite your payment at the quoted rate and a higher buffer rate and see if you still cash flow. Keep liquidity covering down payment plus closing plus 3 to 6 months of reserves.
Management Setup (First 30 to 90 Days)
Tenant screening system. Written criteria and consistent steps.
Lease and rules. Late fees, maintenance reporting, and utilities responsibility.
Maintenance budget. Use benchmarks as a sanity check with single-family maintenance cited at roughly $137 per month average and multifamily maintenance at roughly $8,657 per unit annually.
Vacancy plan. Pre-make a turn checklist covering paint, cleaning, photos, and showing schedule.
Tracking. Separate property bank account and monthly P&L review.
Three quick examples in action. A buyer discovers insurance is 30% higher than assumed and renegotiates price. A landlord sets reserves upfront and covers a surprise water-heater replacement without debt. A DIY landlord standardizes screening and reduces late pays and turnover.
Common Questions
What is a healthy expense ratio for a first rental property?
For small multifamily, many operators consider 35% to 45% of income a healthier underwriting range, with below 35% being unusually lean in most cases. For single-family rentals, maintenance alone has been cited around $137 per month on average and tends to rise with property age. Underwrite conservatively and treat any savings as upside rather than expected performance.
How much vacancy should I assume when underwriting?
Start with reality-based baselines. Census data measured 5.3% vacancy for single-family rentals and 7.8% for multifamily of 5 or more units in Q1 2024. Your submarket can be tighter or looser, so also track days-on-market for comparable rentals locally. Underwrite vacancy even if a unit is currently occupied.
Are DSCR loans a bad choice for first-time investors?
Not inherently. DSCR loans can be useful, especially for LLC borrowers. But you must price them correctly into your deal. DSCR lenders commonly prefer roughly 1.25 or higher for better terms with 75% to 80% LTV caps typical. If your deal only works at lower rates than currently available, it is not a deal. It is a bet.
Why do investors still struggle when national delinquency rates are low?
Because macro delinquency does not equal micro profitability. National serious delinquency rates near 0.5% to 0.6% signal overall mortgage health, but your rental can still struggle due to vacancy, repairs, local rent softness, or poor tenant screening. Reserves, conservative underwriting, and repeatable systems are the protections that actually matter at the property level.
What is the most expensive mistake first-time landlords make?
Weak tenant screening is consistently the most expensive shortcut. A rushed placement to avoid vacancy often leads to late payments, property damage, and eventual eviction costs that far exceed the vacancy loss you were trying to avoid. Written criteria, income verification, and landlord reference calls cost almost nothing and prevent the most damaging outcomes.
How much cash should I have in reserve after closing on my first rental?
Plan for at least 3 to 6 months of total housing expense including mortgage, taxes, insurance, and estimated maintenance. This covers a vacancy stretch, a major repair, or both happening at once. If your reserves are depleted by the down payment and closing costs alone, the deal is likely too thin to absorb normal operating volatility.
Next Steps
If you want to avoid repeating the classic first-time rental property investor mistakes, your best next step is to formalize how you evaluate and underwrite deals before you look at the next listing. That starts with centralizing your lease files, rent roll, income and expense tracking, and property-level reporting so you are not rebuilding your records from scratch after every acquisition.
Frequently Asked Questions
Find answers to common questions about our products and services
What are the steps to buying a rental property for the first time?
What financing option is best for rental property beginners?
What operational systems do I need before scaling beyond my first rental property?
How do I evaluate a rental property quickly without missing red flags?
How do I pick a rental market when rent growth is slowing?
The property acquisition decisions that matter most are the ones made before closing: normalizing expenses, stress-testing financing assumptions, verifying rent rolls, and building a stabilization plan. After closing, the returns you modeled are only protected if operations run consistently. Platforms like Shuk Rentals support post-acquisition performance by bringing rent collection, maintenance tracking, lease management, and tenant communication into one connected system so the gap between your underwriting model and your actual NOI stays as narrow as possible. Tags: Property Acquisition, Rental Property Investment, Buying Rental Property, Real Estate Investing, Property Financing, Market Analysis, Portfolio Scaling, Landlord Tools, Property Management, Self-Managing Landlord

